Portfolio Manager Commentary Q1 '25
Contents
Dear Client,

Tony Arsta, CFA
Chief Investment Officer, Motley Fool Wealth ManagementIt will be a few days before this letter reaches you, but as I sit down to draft it today the S&P 500 is currently down 4%, the NASDAQ is down over 5%, and the Russell 2000 is down 6.3%. I can’t tell you where we’ll be a week from now – or a year from now – but I am eager to tell you about our approach to managing your portfolio during this time, specifically, and during ‘times like these’ more broadly.
Today’s nosedive comes on the heels of a couple months of markets slowly trending down. The reasons for this drawdown are unique to our times, but drawdowns of this kind are far from unique.
As you may know, U.S. markets have experienced a remarkable run over the last decade and a half, handily outpacing international markets by strong margins. Essentially, we believe this was due to investors’ confidence continuing to grow higher in U.S.-based companies, and thus they were willing to pay higher multiples of then-current earnings for the privilege of owning shares of U.S. companies.
This has resulted in great returns for U.S. investors over the last couple of years, with the S&P 500 delivering a whopping 57% over a two-year period of 2023 to 2024 (and this in spite of persistent worry over inflation, interest rates, and recession). At the same time, the soaring valuations of U.S. stocks have made it more challenging for us to take positions in companies we love at prices we feel are reasonable.
While a 10% or even 20% drawdown can be unnerving, especially in the face of unique challenges, we know that historically these kinds of pullbacks have been quite common, as the market has fallen often and recovered quickly in the past. This chart from Calamos shows that, “In 22 of the last 42 calendar years—more than half of the time—the S&P 500 saw a double-digit pullback within the year. ...In the years when the S&P did experience a double-digit decline, 14 of those 22 times—or 64% of the time—the market ended the year with a positive return." 1
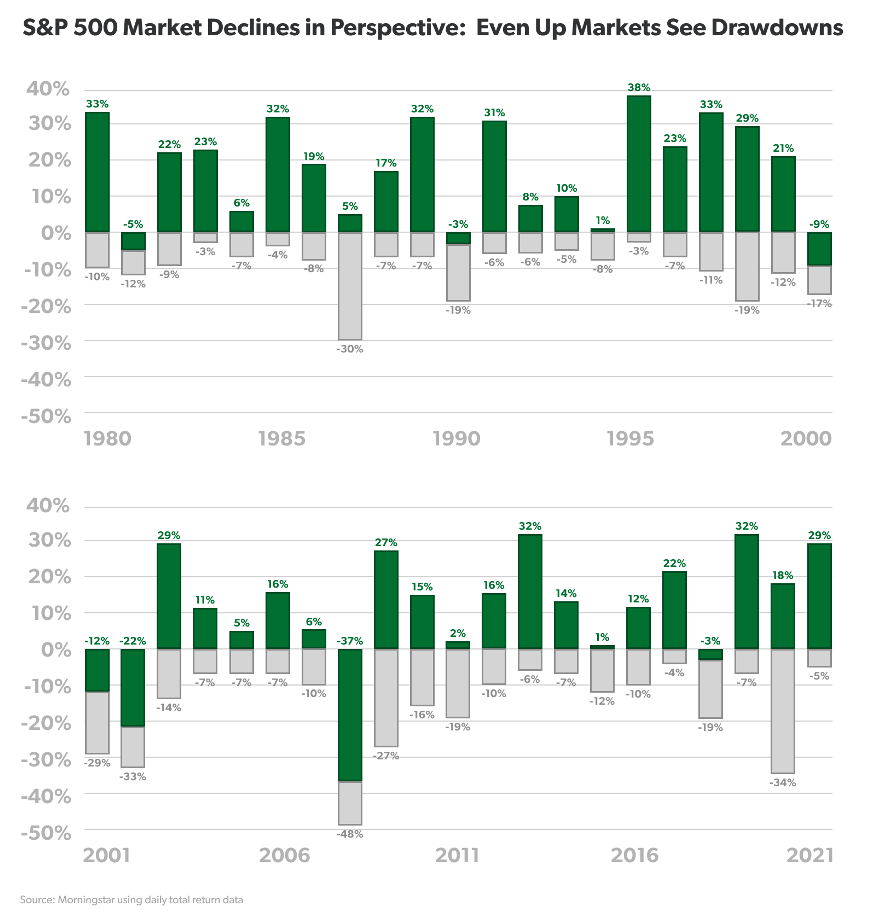
This is not a prediction that the market will end with positive returns for 2025, but a reminder that drawdowns have been a common occurrence, and that historically the market eventually always recovered and went on to new heights over time in the past.
For your Fool Wealth portfolio managers, we tend to see these drawdowns as a chance to bargain hunt. Even after this last quarter, valuations in our opinion remain quite high for many U.S. stocks, but more opportunities are appearing. With so much investor attention on the U.S. over the last several years, we’ve been finding attractive buying opportunities in other parts of the world. As U.S. markets experience a period of volatility, we hope more investors begin to see the value of companies we scooped up while most attention was directed inward.
We continue to home in on a number of attractive businesses abroad, particularly in Europe, and you’ll likely see your asset allocation weighted slightly more toward our International portfolio in your annual recommended rebalance.
At the same time, this pullback in U.S. markets may afford us the opportunity to enter positions we’ve been patiently monitoring for months or even years at a price that could potentially lead to greater returns for you.
Forging ahead in a volatile market
I don’t mean to sugar-coat it. These are challenging times and there are many reasons for concern and even alarm. But whatever happens in international trade, domestic policy, or the world economy, our job is to guide your portfolio through thick and thin, hopefully finding opportunities for you that other portfolio managers might overlook while managing volatility.
Risk and volatility can frighten investors away from the stock market. But taking that risk and weathering that volatility is exactly what has historically allowed stock investors to enjoy compounding returns and grow their wealth over time. We believe that this too shall pass, businesses will remain resilient, and the overall stock market should increase in value as it has for many decades in the past.
All that being said, it may be a good time to take stock of your emotions. If you’re losing sleep due to this recent plunge, it may be worth adjusting your asset allocation to be more conservative moving forward. If you tend to be the defiant type, the kind who is “greedy when others are fearful,” we may be able to adjust your allocation to be more aggressive, though that may lead to greater volatility along the way forward. Keep in mind that there is not a single “correct” amount of risk that everyone should take; your own well-being (financial and mental) is at stake. Successful investing can be as much emotional as it is intellectual. From our POV, the ability to feel confident about your plan and stick with it is critical to long-term success. For most clients, we have options for dialing your risk profile up or down that will still align with your fiduciary best interest, current needs, and future goals. If you think you’d like to make an adjustment – in either direction – don’t hesitate to reach out.
Strong companies tend to gain ground during challenging times. We remain focused on identifying what we believe to be resilient companies with the potential to emerge from the present tumult even stronger. We remain committed to our Foolish investment process and confident in our ability to navigate the ever-shifting marketplace on your behalf.
As always, your financial well-being is our top concern. I’m grateful for your continued trust in our management as we seek the very best investments to help you achieve your long-term financial goals.
Sincerely,
Tony Arsta
Chief Investment Officer,
Motley Fool Wealth Management
1. "Significant Intra-Year Drawdowns Are Common" | Calamos Investments
The above information and the following Quarterly Performance Report (“Report”) are intended solely for current clients of Motley Fool Wealth Management (“MFWM”) for the purpose of providing insight into how we manage our strategies and our investment philosophy. This information should not be disclosed to third parties or duplicated or used for any purpose other than the purpose for which it has been provided.
Similarly, all information presented herein is for informational purposes only and should not be deemed as investment advice or a recommendation to purchase or sell any specific security. This information reflects the opinions, estimates and projections of MFWM as of the date of publication, which are subject to change without notice.
Performance results discussed in the Report represent past performance, which does not guarantee future results. The performance information presented herein includes information describing certain periods of extreme market conditions, and such results should not be considered repeatable in future periods. The investment return and principal value of an investment will fluctuate so that current performance may be lower or higher than the performance discussed in the Report.
Dividend
Portfolio Managers
Tony Arsta, CFAJeremy Myers, CFA
The Dividend strategy performed relatively well in the first quarter, managing to generate a positive return in a volatile, downward-trending market. During the first quarter, the Dividend strategy posted a 1.50% return, net of fees, versus a -4.27% return for its benchmark, the S&P 500®.
Over the past two years the Dividend strategy has underperformed as growth stocks rocketed higher, leading the market to 20%-plus gains each year. Thanks to stretched valuations and a reduction in investors' risk appetite, market leadership has flipped with value leading the pack in the first quarter of 2025. The outperformance of the Dividend strategy can largely be attributed to two factors. The first was a general flight to safety during a period of volatility and the second is the rising expectations that slowing economic growth will lead to interest rate cuts later in the year.
More defensive sectors, like energy, healthcare, utilities, and consumer staples were all positive returners during the quarter, while the previously high-flying technology and consumer discretionary sectors both posted double-digit losses. Investors have become more wary of the new administration’s tariff-centric trade policy and have begun to anticipate slowing economic growth later in the year. Even worse, there’s growing concern that stagflation – price increases paired with little or no economic growth – will take hold, which historically has been a worst-case scenario for the stock market.
In this environment we remain cautious, but we’re also confident that our focus on quality businesses will help alleviate some of the downside volatility of the market. We see these market drawdowns as opportunities to add some of those growthier businesses to the portfolio at attractive valuations. This should put us in a better position to keep pace when the market rebounds while maintaining the oval risk profile of the Dividend strategy.
| QTD | YTD | 1Y | 3Y | 5Y | |
|---|---|---|---|---|---|
| US Large Cap Dividend | 1.50 | 1.50 | 6.86 | 2.60 | 10.77 |
| Benchmark (S&P 500) | -4.27 | -4.27 | 8.28 | 9.07 | 18.60 |
Factoring in size and performance, the portfolio’s largest contributor, and largest detractor, were as follows:
- WEC: 16.89% return; 6.26% weighting
- Equinix: -13.08% return; 5.22% weighting
It’s not often that a utility makes the top performer list, but these aren’t normal times. Midwest utility WEC posted strong performance thanks to a positive outcome for the company’s multi-year Wisconsin rate case. This signals support for the $28 billion of capital investment the company plans to make in the region to meet growing demand, including that from multiple large data center projects either under construction or in development by Microsoft. We expect that investors should continue to look for dependable, high-quality utilities like WEC to provide ballast to their portfolios in a volatile market environment.
Despite strong quarterly results, and ongoing demand for what we believe to be a differentiated data center offering—one characterized by the need for interconnection, and less commoditized relative to its peers—Equinix shares declined on worries of overcapacity in data center builds, peaking AI-driven capex amid DeepSeek’s release, and the possibility of declining returns on capital. While these might be near-term headwinds, we take a much longer view of Equinix’s prospects. The company’s growth is indexed to two popular secular phenomena: migration of workloads to the cloud and digital data. Because Equinix is located at key internet exchange points and counts a critical mass of key internet stakeholders as tenants, it operates as an interchange of sorts for data, facilitating more efficient exchange and processing—allowing it to extract an ever-growing toll on data flows. We don’t expect this to change, given a long view, and expect it to routinely grow AFFO—its measure of cash flow—at high single digit rates. As shares trade near 20 times our estimate of 2025 AFFO, we think they represent solid value.
Transactions
During the quarter, we started a new position in West Pharmaceuticals, a market leader in the design and manufacturer of innovative, high-quality injectable drug packaging and delivery systems. We view West as an exceptional business with a wide moat, and we’ve been waiting patiently for a more attractive valuation to invest. The company recently posted disappointing quarterly earnings and weaker than expected guidance causing the stock price to crater over 35%. We think the pullback was more a result of an over-inflated valuation falling back to earth than a long-term impairment of the business. Longer-term we think West should be well-positioned to be a pick-and-shovel supplier to a new class of promising drugs in biologics and GLP-1s and the company should be returning to more normalized growth over the next few quarters.
The above information is intended solely for current clients of Motley Fool Wealth Management (“MFWM”) for the purpose of providing insight into how we manage our strategies and our investment philosophy. This information should not be disclosed to third parties or duplicated or used for any purpose other than the purpose for which it has been provided.
All information presented herein is for informational purposes only and should not be deemed as investment advice or a recommendation to purchase or sell any specific security. This information reflects the opinions, estimates and projections of MFWM as of the date of publication, which are subject to change without notice. We do not represent that any opinion, estimate or projection will be realized. While we believe this information to be reliable, no representation or warranty is made concerning its accuracy.
Performance results are based on a representative account for each strategy, not individual client accounts. Clients can see their actual account performance on the Interactive Brokers’ website at any time. Client account results may not exactly match the performance of the representative accounts. Such variance is due to a number of factors, including differences in trade prices, transaction fees, market activity, any restrictions have you may have imposed on your account(s), and the amount and the timing of deposits or withdrawals.
The performance information presented herein has been generated during a period of extraordinary market volatility. Accordingly, the performance is not necessarily indicative of results that we may achieve in the future, and we do not represent and it cannot be assumed that the performance of our strategies will be subject to the same economic risk factors that contributed to the above returns. Performance results discussed above represent past performance, which does not guarantee future results. The investment return and principal value of an investment will fluctuate so that current performance may be lower or higher than the performance discussed above. The investment strategy and focus of our model portfolio strategies can change over time. Similarly, there is no assurance that the securities purchased will remain in a model portfolio strategy or that securities sold may not be repurchased. The mention of specific holdings does not constitute a recommendation by MFWM or its affiliates.
To the extent we invest more heavily in particular sectors or industries of the economy, the performance of our strategies will be especially sensitive to developments that significantly affect those sectors or industries. While investing in a particular sector is not a principal investment strategy of any model portfolio, client portfolios may be significantly invested in a sector or industry as a result of our portfolio management decisions. Similarly, a model portfolio’s investment may become concentrated in a small number of issuers. To the extent that we take large positions in a small number of investments, account returns may fluctuate as a result of changes in the performance of such investments to a greater extent than that of a more diversified account. Returns realized by a client account may be adversely affected if a small number of these investments perform poorly.
Index performance is discussed for illustrative purposes only as a benchmark for each strategy’s performance, and does not predict or depict performance of that strategy. While index comparisons may be useful to provide a benchmark for a strategy’s performance, it must be noted that investments are not limited to the investments comprising the indices. Each of the strategy benchmark indices are unmanaged and cannot be purchased directly by investors. It is not possible to invest in an index.
This message is provided for informational purposes only, reflects our general views on investing and should not be relied upon as recommendations or financial planning advice. We encourage you to seek personalized advice from qualified professionals, including (without limitation) tax professionals, regarding all personal finance issues. While we can counsel on tax efficiency and general tax considerations, MFWM does not (and is not permitted to) provide tax or legal advice. Clients who need such advice should consult tax and legal professionals. This message may not be relied upon as personalized financial planning or tax advice.
MFWM is an SEC registered investment advisor with a fiduciary duty that requires it to act in the best interests of clients and to place the interests of clients before its own. HOWEVER, REGISTRATION AS AN INVESTMENT ADVISOR DOES NOT IMPLY ANY LEVEL OF SKILL OR TRAINING. Access to MFWM is only available to clients pursuant to an Investment Advisory Agreement and acceptance of our Client Relationship Summary and Brochure (Form ADV, Parts 2A and 2B). You are encouraged to read these documents carefully. All investments involve risk and may lose money. MFWM does not guarantee the results of any of its advice or account management. Clients should be aware that their individual account results may not exactly match the performance of any of our Model Portfolios. Past performance is no guarantee of future results. Each Personal Portfolio is subject to an account minimum, which varies based on the strategies included in the portfolio. MFWM retains the right to revise or modify portfolios and strategies if it believes such modifications would be in the best interests of its clients.
During discussions with our Wealth Advisors, they may provide advice with respect to 401(k) and IRA rollovers into accounts that are managed by MFWM. Such recommendations pose potential conflicts of interest in that rolling retirement savings into a MFWM managed account will generate ongoing asset-based fees for MFWM that it would not otherwise receive.
Fixed Income
Portfolio Managers
Tony Arsta, CFANate Weisshaar, CFA
Fixing the wrongs? Detox?1 Facing reality? Chaos?
Whatever you call it, the first quarter of 2025 was dramatic. We saw President Trump re-enter office swinging with his tariffs, cost cutting, and diplomatic terseness.
Are they just negotiating tactics? Perhaps. But "perhaps" is not an answer markets like to hear. Markets prefer certainty and steadiness.
The past several years suggest they also like loose fiscal and monetary policy. However, too much of that generally leads to inflation, government deficits, and currency weakness which spawn uncertainty – too much of a good thing, you might say.
Along with domestic turmoil, we've also seen meaningful policy shifts in Germany and China, two of the largest exporting and saving economies in the world.
To pull themselves out of a persistent recession, Germany has adjusted their debt brake – a measure put into Germany's constitution in 2009 to limit federal deficit spending.2 It is estimated that this could inject €1 trillion, or roughly one-fifth of Germany's annual GDP, into the global economy over the next several years.3
Meanwhile, halfway around the globe, China is also struggling with a weak economy as political reforms have led to a collapse in the country's real estate market4 – a key savings instrument for Chinese citizens and historically a large driver of GDP growth. At the same time, aftershocks from the COVID lockdowns continue to stifle consumer and local government spending.5
In response – and in a sharp policy reversal – China's government has announced a series of efforts to support real estate developers and spur business investment and consumption of appliances and other consumer goods.67
What impact will changing trade patterns (a result of tariffs and reshoring) and fiscal policies have on US interest rates and the strength of the dollar? That's to be determined (another phrase the market doesn't like).
So far, it appears markets are anticipating slowing growth as long-term interest rates have come down – the 10-year Treasury rate declined 35 basis points (bp = 1/100th of a percentage point) between the end of January and the end of March.8
At the same time, the spread on high yield credit (how much more riskier companies have to pay to borrow than the US government) increased 87bp to 355bp (also known as 3.55 percentage points),9 indicating to us that investors are increasingly concerned about getting paid back by high risk borrowers.
To be clear, spreads are still historically low – in times of run-of-the-mill economic stress these spreads can be between 5 and 10 percentage points – just less low than they were two months ago. Similarly, investment grade borrowers (less reliable than the government, but still pretty good bets to repay) saw their spreads increase 15bp and remain historically low.10
So, investors are a little worried, but from our point of view, seem to be anticipating only short-term pain from any economic slowdown. Several investment banks (people paid a lot to be very smart about markets) have raised their expectations of a recession in the next 12 months. JP Morgan and Moody's put the probability at 40%, up from 30% and 15%, respectively, at the beginning of the year. Goldman Sachs is slightly more sanguine, giving us a 35% chance of entering recession this year (up from 20%).11 12 13
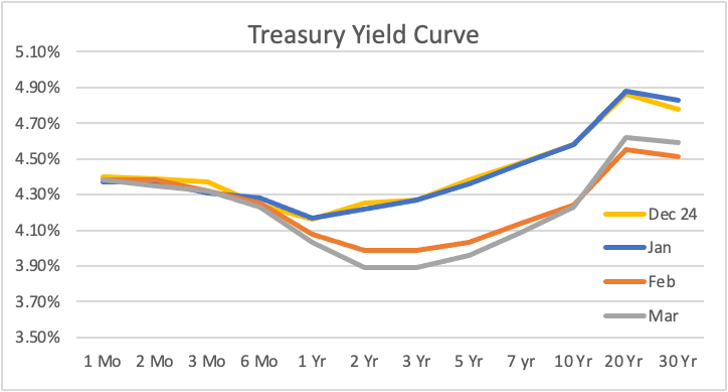
All of this, along with the Trump administration's own statements about focusing on the 10-year rate, suggest we may have seen a top in interest rates, at least for the time being.14
With this in mind, your portfolio managers have been gradually shifting your Fixed Income SMA toward a longer-duration structure. In fact, by moving funds into later rungs on our corporate bond ladder, as well as a few other similar moves, the weighted duration of the SMA has increased from 2.7 a year ago to 3.3 as of quarter-end.
While there are lots of technical terms I can use to explain these moves, the ultimate goal is to lock in the recently high rates in order to provide as much income as possible in the next couple of years, during which we expect rates available for reinvestment to decline.
This is a markedly different world than we've been in for quite some time, and we believe the current market uncertainty will likely give us opportunities to boost returns.
One such opportunity occurred in mid-January when long-term rates approached 5%.15 Your managers believed that arbitrary (though psychologically pleasing) level would spark investor appetite and bond buying, driving rates back down to the mid-4%s (where we believed rates "should" be based on inflation and risk appetites at the time).
We therefore bought a 10% position in the iShares 20+ Year Treasury Bond ETF. These long-dated, less risk securities would see the most price appreciation if rates declined as we expected. We turned out to be correct and 20-year Treasury rates declined 39bp between January 14 and March 12 (when we closed the position). This move resulted in the price of the ETF increasing from around $84.50 to almost $90 – a roughly 6% return in about two months.16
This trade, along with the shifts to longer-dated, higher yielding rungs on our corporate ladder delivered results in line with the benchmark this quarter. Please note, our benchmark has a longer duration – currently around 4 years – than the Fixed Income SMA, so is expected to outperform when rates are falling. Delivering in-line performance this quarter was a pleasant result. After two solid quarters, we continue to close the gap in long-term performance.
| QTD | YTD | 1Y | 3Y | 5Y | 10Y | |
|---|---|---|---|---|---|---|
| Fixed Income | 2.26 | 2.26 | 5.41 | 2.24 | 1.31 | 1.05 |
| Bloomberg Barclays US Corporate Bond Index | 2.27 | 2.27 | 6.32 | 2.99 | 2.60 | 2.75 |
In this environment of actual interest income potential, we humbly suggest our active management is showing its worth. While opportunistically pursuing trades to bolster returns, we have not forgotten our guiding goal: Create a low-risk, income-generating portfolio that provides a reliable source of liquid funds for your life events or as dry powder for opportunities in equity markets.
So, while we have made moves to deliver returns above our historical average, we remain steadfast in our promise not to take on unnecessary risk to do so. Our tactical trade of the long-term bond ETF was limited in size and relatively low risk – had rates not moved as we expected, there was minimal risk of permanent capital loss.
We continue to, as closely as we can, create a portfolio that behaves as if we’re buying bonds and holding them until they mature. This structure means daily price moves of the individual ETFs and their underlying bonds are of little importance to us. We care about the yield you receive from the bonds, the return of your capital at the maturity of the bonds, and the reinvestment options available at the time of maturity.
At the time of writing, maturity-date ETFs made up roughly 80% of the SMA and the portfolio had an average weighted yield to maturity of 5.13%. This is down 4bp from a quarter ago.
In many ways, the world is more interesting than it was when this quarter began. What that means for interest rates and your Fixed Income SMA remains to be seen, but your portfolio managers will continue to look for opportunities to build the ballast of your overall portfolio.
1. "US Economy Government Spending Detox" The Hill 2. "Germany's Rocky Path to New Debt Settlement" Reuters, 7 March 2025 3. "Germany: Economy" CIA World Factbook 4. "China's New Home Prices Fall in February" Reuters, 17 March 2025 5. "The COVID-19 Pandemic's Impact on the Chinese Economy" China Currents 6. "Has China's Property Market Reached the Bottom" Goldman Sachs 7. "China Industrial Equipment Upgrading" Trade.gov 8. "Daily Treasury Yield Curve" US Department of the Treasury, 2025 9. "ICE BofA US High Yield Index Option-Adjusted Spread" FRED, Federal Reserve Bank of St. Louis 10. "ICE BofA US Corporate Index Option-Adjusted Spread" FRED, Federal Reserve Bank of St. Louis 11. "JP Morgan Economist Sees 40% US Recession Chance" Reuters, 12 March 2025 12. "Mark Zandi's Update on Recession Probability" X (formerly Twitter) 13. "Goldman Sachs Raises Probability Of A U.S. Recession To 35%" NPR, 1 April 2025 14. "Bessent's Focus on 10-Year US Treasury Yield May Let Fed Off Hook" Reuters, 6 February 2025 15. "Daily Treasury Yield Curve Rates, January 7-14, 2025" US Department of the Treasury 16. "iShares 20+ Year Treasury Bond ETF (TLT) Historical Data" Yahoo Finance
The above information is intended solely for current clients of Motley Fool Wealth Management (“MFWM”) for the purpose of providing insight into how we manage our strategies and our investment philosophy. This information should not be disclosed to third parties or duplicated or used for any purpose other than the purpose for which it has been provided.
All information presented herein is for informational purposes only and should not be deemed as investment advice or a recommendation to purchase or sell any specific security. This information reflects the opinions, estimates and projections of MFWM as of the date of publication, which are subject to change without notice. We do not represent that any opinion, estimate or projection will be realized. While we believe this information to be reliable, no representation or warranty is made concerning its accuracy.
Performance results are based on a representative account for each strategy, not individual client accounts. Clients can see their actual account performance on the Interactive Brokers’ website at any time. Client account results may not exactly match the performance of the representative accounts. Such variance is due to a number of factors, including differences in trade prices, transaction fees, market activity, any restrictions have you may have imposed on your account(s), and the amount and the timing of deposits or withdrawals.
The performance information presented herein has been generated during a period of extraordinary market volatility. Accordingly, the performance is not necessarily indicative of results that we may achieve in the future, and we do not represent and it cannot be assumed that the performance of our strategies will be subject to the same economic risk factors that contributed to the above returns. Performance results discussed above represent past performance, which does not guarantee future results. The investment return and principal value of an investment will fluctuate so that current performance may be lower or higher than the performance discussed above. The investment strategy and focus of our model portfolio strategies can change over time. Similarly, there is no assurance that the securities purchased will remain in a model portfolio strategy or that securities sold may not be repurchased. The mention of specific holdings does not constitute a recommendation by MFWM or its affiliates.
To the extent we invest more heavily in particular sectors or industries of the economy, the performance of our strategies will be especially sensitive to developments that significantly affect those sectors or industries. While investing in a particular sector is not a principal investment strategy of any model portfolio, client portfolios may be significantly invested in a sector or industry as a result of our portfolio management decisions. Similarly, a model portfolio’s investment may become concentrated in a small number of issuers. To the extent that we take large positions in a small number of investments, account returns may fluctuate as a result of changes in the performance of such investments to a greater extent than that of a more diversified account. Returns realized by a client account may be adversely affected if a small number of these investments perform poorly.
Index performance is discussed for illustrative purposes only as a benchmark for each strategy’s performance, and does not predict or depict performance of that strategy. While index comparisons may be useful to provide a benchmark for a strategy’s performance, it must be noted that investments are not limited to the investments comprising the indices. Each of the strategy benchmark indices are unmanaged and cannot be purchased directly by investors. It is not possible to invest in an index.
This message is provided for informational purposes only, reflects our general views on investing and should not be relied upon as recommendations or financial planning advice. We encourage you to seek personalized advice from qualified professionals, including (without limitation) tax professionals, regarding all personal finance issues. While we can counsel on tax efficiency and general tax considerations, MFWM does not (and is not permitted to) provide tax or legal advice. Clients who need such advice should consult tax and legal professionals. This message may not be relied upon as personalized financial planning or tax advice.
MFWM is an SEC registered investment advisor with a fiduciary duty that requires it to act in the best interests of clients and to place the interests of clients before its own. HOWEVER, REGISTRATION AS AN INVESTMENT ADVISOR DOES NOT IMPLY ANY LEVEL OF SKILL OR TRAINING. Access to MFWM is only available to clients pursuant to an Investment Advisory Agreement and acceptance of our Client Relationship Summary and Brochure (Form ADV, Parts 2A and 2B). You are encouraged to read these documents carefully. All investments involve risk and may lose money. MFWM does not guarantee the results of any of its advice or account management. Clients should be aware that their individual account results may not exactly match the performance of any of our Model Portfolios. Past performance is no guarantee of future results. Each Personal Portfolio is subject to an account minimum, which varies based on the strategies included in the portfolio. MFWM retains the right to revise or modify portfolios and strategies if it believes such modifications would be in the best interests of its clients.
During discussions with our Wealth Advisors, they may provide advice with respect to 401(k) and IRA rollovers into accounts that are managed by MFWM. Such recommendations pose potential conflicts of interest in that rolling retirement savings into a MFWM managed account will generate ongoing asset-based fees for MFWM that it would not otherwise receive.
International
Portfolio Managers
Tony Arsta, CFAMichael Olsen, CFA
Let’s dispense with the obvious. What happened last quarter, and the weeks since its end, was less than customary. And to be abundantly clear, we’re purposefully erring on the side of understatement. Uncertainty surrounding the Trump administration’s disposition with respect to tariffs, historical alliances and trade partnerships, globalism, and, really, just about everything we’d previously taken as gospel prevailed in international and domestic markets. Volatility followed, as investors made their best attempt at divining the likely course. We don’t take this lightly, or discount its prospective impact. We’d also assert that if anyone affirmatively and unequivocally posits they have some notion of what might transpire, they’re almost certainly misguided or deluded. Simply speaking, we don’t know.
But that doesn’t mean we, as investors, are without recourse or defense. As business-focused, long-term investors, we remain focused on what we can control. Within the confines of your International SMA, that means one thing: building a portfolio of international enterprises whose underlying offering we believe is intractable, near-impossible to replicate, and in service of some core societal need. Given a long-enough horizon, we expect these businesses to perform well across a broad range of macroeconomic environments.
We’d also highlight an important, and heretofore forgotten, learning from recent months: while international diversification seemed whimsical and arguably foolhardy amid U.S. equities’ longstanding outperformance, this quarter made boldface and manifest the notion that international diversification matters. For the first time in what seems like ages, European equities’ allure became apparent to investors—a position we’ve held for some time, as evinced by our overweight in Euro equities.
Against this backdrop, the International SMA returned 1.86% net of fees, versus 4.33% for its benchmark. While we’re unhappy with its underperformance, we’d emphasize two points. First, we’re long-term investors and a quarter is hardly telling of a business’ underlying merits. Two fairly-sized positions, ICON and Novo Nordisk, underperformed, but we believe their longer-term prospects remain bright. The second point to emphasize is the reason for our relative underperformance. The underlying index benefited from the strength of European banks and defense companies, neither of which we own. We couldn’t have surmised the European defense complex would rally smartly as the EU considered rearmament as the future of NATO fell in question. And in European banks, we’ve consciously chosen not to own the enterprise, because they do not meet our threshold for quality. European banks have long posted dour numbers relative to their more developed-world counterparts, and broader comparatives.
We’d close by noting that while the near-term is uncertain, to put it mildly, we remain optimists regarding the long-term arc of society and the global economy. Despite world wars, pandemics, periods of manifest inflation and stagflation, and various seemingly intractable problems, the past century has presided over what might be the greatest aggregate improvement in economic and physical quality of life ever witnessed. Investors, particularly those in equities, presided over the spoils. We don’t think the best is behind us. And for this reason, we remain investors—and will opportunistically take advantage as the markets allow.
| QTD | YTD | 1Y | 3Y | 5Y | 10Y | |
|---|---|---|---|---|---|---|
| International | 1.86 | 1.86 | -1.37 | 3.01 | 10.78 | 4.70 |
| S&P Global ex-U.S. | 4.33 | 4.33 | 5.91 | 4.45 | 11.45 | 5.56 |
A review of key contributors to the portfolio’s quarterly results follows. As we’ve written before, a portion of the International SMA remains invested in ETFs to achieve geographic exposures: 11.74% on average, returning 8.20% on a weighted average basis. On a weighted basis, giving effect to average weighting and absolute return, the portfolio’s largest contributor, and largest detractor, were as follows:
- Nintendo: 17.36% return; 5.02% weighting
- ICON: -16.56% return; 3.56% weighting
Nintendo ADR shares gained 17% in the first quarter of 2025, increasing ahead of Nintendo’s highly anticipated Switch 2 console—successor to the first Switch console, which sold 150 million units worldwide. This will be Nintendo’s first console in eight years, carrying substantial hardware upgrades that should allow smooth gameplay of leading AAA titles and likely attract more third party developers to Nintendo’s platform. We think there will be significant demand and this will kick off a new multi-year product cycle. We also expect the company to continue making progress in digitalization, and expanding the Nintendo ecosystem—online subscription model, theme parks, movies— potentially leading to a more sustainable business model, better across the cycle cash generation, and a more premium valuation.
Outsourced R&D purveyor to biopharmaceutical companies, ICON, was the subject of another drubbing in the quarter past. The culprits were threefold: the company posted muted guidance, as two major customers restructured contracts with ICON; investors worried over the long-tailed impacts of reduced NIH funding on drug development; and uncertainty regarding newly-appointed HHS secretary Robert F. Kennedy Jr.’s notions for the FDA, drug development, and vaccines. While we don’t discount these issues, and they represent real risks, we think it behooves investors to widen the aperture—and take a longer view of ICON’s prospects.
We make no bones about it: The near-term is uncertain. But at its core, we believe the arc of drug development spend and outsourcing should increase over the long-term. Because drug development is a long-tailed game, it’s incumbent upon biopharmas to invest with a multi-year horizon. Equally significant, we believe ICON should be an outsized beneficiary—its global scale, deep relationships with biopharmas, and expertise across a wide range of therapeutics endow it with hard-to-replicate advantages—as biopharmas attempt to mitigate near-term pressures by outsourcing, allowing them to introduce variability to an otherwise fixed cost. Last and significantly, ICON shares, at 11 times our estimate of trailing free cash flow, effectively presume the company will cease to grow. Given a long view, we believe that assertion will prove to be wrong.
Portfolio Activity
We did not make any trades in Q1.
The above information is intended solely for current clients of Motley Fool Wealth Management (“MFWM”) for the purpose of providing insight into how we manage our strategies and our investment philosophy. This information should not be disclosed to third parties or duplicated or used for any purpose other than the purpose for which it has been provided.
All information presented herein is for informational purposes only and should not be deemed as investment advice or a recommendation to purchase or sell any specific security. This information reflects the opinions, estimates and projections of MFWM as of the date of publication, which are subject to change without notice. We do not represent that any opinion, estimate or projection will be realized. While we believe this information to be reliable, no representation or warranty is made concerning its accuracy.
Performance results are based on a representative account for each strategy, not individual client accounts. Clients can see their actual account performance on the Interactive Brokers’ website at any time. Client account results may not exactly match the performance of the representative accounts. Such variance is due to a number of factors, including differences in trade prices, transaction fees, market activity, any restrictions have you may have imposed on your account(s), and the amount and the timing of deposits or withdrawals.
The performance information presented herein has been generated during a period of extraordinary market volatility. Accordingly, the performance is not necessarily indicative of results that we may achieve in the future, and we do not represent and it cannot be assumed that the performance of our strategies will be subject to the same economic risk factors that contributed to the above returns. Performance results discussed above represent past performance, which does not guarantee future results. The investment return and principal value of an investment will fluctuate so that current performance may be lower or higher than the performance discussed above. The investment strategy and focus of our model portfolio strategies can change over time. Similarly, there is no assurance that the securities purchased will remain in a model portfolio strategy or that securities sold may not be repurchased. The mention of specific holdings does not constitute a recommendation by MFWM or its affiliates.
To the extent we invest more heavily in particular sectors or industries of the economy, the performance of our strategies will be especially sensitive to developments that significantly affect those sectors or industries. While investing in a particular sector is not a principal investment strategy of any model portfolio, client portfolios may be significantly invested in a sector or industry as a result of our portfolio management decisions. Similarly, a model portfolio’s investment may become concentrated in a small number of issuers. To the extent that we take large positions in a small number of investments, account returns may fluctuate as a result of changes in the performance of such investments to a greater extent than that of a more diversified account. Returns realized by a client account may be adversely affected if a small number of these investments perform poorly.
Index performance is discussed for illustrative purposes only as a benchmark for each strategy’s performance, and does not predict or depict performance of that strategy. While index comparisons may be useful to provide a benchmark for a strategy’s performance, it must be noted that investments are not limited to the investments comprising the indices. Each of the strategy benchmark indices are unmanaged and cannot be purchased directly by investors. It is not possible to invest in an index.
This message is provided for informational purposes only, reflects our general views on investing and should not be relied upon as recommendations or financial planning advice. We encourage you to seek personalized advice from qualified professionals, including (without limitation) tax professionals, regarding all personal finance issues. While we can counsel on tax efficiency and general tax considerations, MFWM does not (and is not permitted to) provide tax or legal advice. Clients who need such advice should consult tax and legal professionals. This message may not be relied upon as personalized financial planning or tax advice.
MFWM is an SEC registered investment advisor with a fiduciary duty that requires it to act in the best interests of clients and to place the interests of clients before its own. HOWEVER, REGISTRATION AS AN INVESTMENT ADVISOR DOES NOT IMPLY ANY LEVEL OF SKILL OR TRAINING. Access to MFWM is only available to clients pursuant to an Investment Advisory Agreement and acceptance of our Client Relationship Summary and Brochure (Form ADV, Parts 2A and 2B). You are encouraged to read these documents carefully. All investments involve risk and may lose money. MFWM does not guarantee the results of any of its advice or account management. Clients should be aware that their individual account results may not exactly match the performance of any of our Model Portfolios. Past performance is no guarantee of future results. Each Personal Portfolio is subject to an account minimum, which varies based on the strategies included in the portfolio. MFWM retains the right to revise or modify portfolios and strategies if it believes such modifications would be in the best interests of its clients.
During discussions with our Wealth Advisors, they may provide advice with respect to 401(k) and IRA rollovers into accounts that are managed by MFWM. Such recommendations pose potential conflicts of interest in that rolling retirement savings into a MFWM managed account will generate ongoing asset-based fees for MFWM that it would not otherwise receive.
Large Cap Core
Portfolio Managers
Tony Arsta, CFAJeremy Myers, CFA
The first quarter was a bumpy ride for investors, but our diversified approach to the Core strategy helped us limit the damage versus the overall market. During the first quarter, the Large Cap Core strategy posted a -2.50% return net of fees versus a -4.27% return for its benchmark, the S&P 500®.
For the past two years, growth stocks have driven the majority of the market’s gains, but thanks to stretched valuations and a reduction in investors’ risk appetite, market leadership has flipped. Value stocks significantly outperformed growth in the first quarter of 2025. More defensive sectors, like energy, healthcare, utilities, and consumer staples were all positive returners, while the previously high-flying technology and consumer discretionary sectors both posted double-digit losses. Notably, the Magnificent Seven stocks are officially in a bear market after collectively falling 20% from their peak. Though we maintain positions in Alphabet, Amazon, Meta Holdings, and Microsoft, all of which experienced greater than 15% drawdowns during the quarter, our relative underexposure to the technology sector helped reduce the portfolio’s volatility.
Investors have become increasingly wary of the new administration’s tariff-centric trade policy and have begun to anticipate slowing economic growth. Even worse, there’s growing concern that stagflation – price increases paired with little or no economic growth – will take hold, which historically has been a worst-case scenario for the stock market. Overall, it appears to us that we could be entering a “risk-off” environment and multiples for growth stocks are contracting. If the economy continues to slow, it’s reasonable to expect the trend may continue in the near term. Though market volatility never feels good when you’re in the middle of it, we welcome the buying opportunities that can be created for long-term-oriented investors.
| QTD | YTD | 1Y | 3Y | 5Y | 10Y | |
|---|---|---|---|---|---|---|
| US Large Cap Core | -2.50 | -2.50 | 5.42 | 7.67 | 15.51 | 12.88 |
| Benchmark (S&P 500) | -4.27 | -4.27 | 8.28 | 9.07 | 18.60 | 12.51 |
Factoring in size and performance, the portfolio’s largest contributor, and largest detractor, were as follows:
- Berkshire: 17.49% return; 7.52% weighting
- Alphabet: -17.87% return; 5.46% weighting
Berkshire Hathaway had quite a nice quarter, gaining 17.5% in the first three months of the year. The insurance segment of the company did quite well, with GEICO continuing to improve its performance. And of course, holding $334 billion in cash has been helpful during recent market volatility. Those positives were enough to offset concerns over policies impacting Berkshire’s wind energy franchise, litigation risks from the company’s utility subsidiary PacifiCorp’s alleged proximity to the California wildfires, possible tariff impacts to the company’s railroad subsidiary BNSF’s traffic between the U.S. and Canada, and the stock price declines of large investments in publicly traded companies like Apple and American Express. It seems investors still believe that the company can be trusted to wisely invest its large cash hoard as opportunities arise. That seems like a wise bet to us, too.
Alphabet, the parent of Google, fell by 17.9% during the quarter. As one of the so-called “Magnificent Seven” stocks, it has still had a nice run over the past two years but has given up a large portion of its gains from 2024. The company has had its share of wins, with YouTube continuing to perform well and some inroads being made as its AI efforts impact both its consumer businesses (Android phones, YouTube, etc.) and its enterprise business (Google Cloud Platform). Offsetting this are myriad concerns. Among them: How will AI impact core Google Search; can Google’s cloud keep pace with Amazon, Microsoft, and potentially other upstart AI-first companies; and how will fears of a recession – or at least a consumer slowdown – impact the ad spending that is still the fuel at the heart of Alphabet’s cash engines? We share these concerns in the short term, but we believe the company’s success in AI research and the success of YouTube – particularly among the younger generations – should keep this business well-positioned going forward (not to mention positive optionality still existing through initiatives such as Alphabet’s Waymo self-driving car technology).
Transactions
During the quarter, we started a new position in West Pharmaceuticals, a market leader in the design and manufacturer of innovative, high-quality injectable drug packaging and delivery systems. We view West as an exceptional business with a wide moat, and we’ve been waiting patiently for a more attractive valuation to invest. The company recently posted disappointing quarterly earnings and weaker than expected guidance causing the stock price to crater over 35%. We think the pullback was more a result of an over-inflated valuation falling back to earth than a long-term impairment of the business. West was a huge outperformer during the pandemic, but sales growth has slowed as its customers reduced inventory levels to pre-Covid levels. Longer-term we think West should be well-positioned to be a pick-and-shovel supplier to a new class of promising drugs in biologics and GLP-1s and the company should be returning to more normalized growth over the next few quarters.
The above information is intended solely for current clients of Motley Fool Wealth Management (“MFWM”) for the purpose of providing insight into how we manage our strategies and our investment philosophy. This information should not be disclosed to third parties or duplicated or used for any purpose other than the purpose for which it has been provided.
All information presented herein is for informational purposes only and should not be deemed as investment advice or a recommendation to purchase or sell any specific security. This information reflects the opinions, estimates and projections of MFWM as of the date of publication, which are subject to change without notice. We do not represent that any opinion, estimate or projection will be realized. While we believe this information to be reliable, no representation or warranty is made concerning its accuracy.
Performance results are based on a representative account for each strategy, not individual client accounts. Clients can see their actual account performance on the Interactive Brokers’ website at any time. Client account results may not exactly match the performance of the representative accounts. Such variance is due to a number of factors, including differences in trade prices, transaction fees, market activity, any restrictions have you may have imposed on your account(s), and the amount and the timing of deposits or withdrawals.
The performance information presented herein has been generated during a period of extraordinary market volatility. Accordingly, the performance is not necessarily indicative of results that we may achieve in the future, and we do not represent and it cannot be assumed that the performance of our strategies will be subject to the same economic risk factors that contributed to the above returns. Performance results discussed above represent past performance, which does not guarantee future results. The investment return and principal value of an investment will fluctuate so that current performance may be lower or higher than the performance discussed above. The investment strategy and focus of our model portfolio strategies can change over time. Similarly, there is no assurance that the securities purchased will remain in a model portfolio strategy or that securities sold may not be repurchased. The mention of specific holdings does not constitute a recommendation by MFWM or its affiliates.
To the extent we invest more heavily in particular sectors or industries of the economy, the performance of our strategies will be especially sensitive to developments that significantly affect those sectors or industries. While investing in a particular sector is not a principal investment strategy of any model portfolio, client portfolios may be significantly invested in a sector or industry as a result of our portfolio management decisions. Similarly, a model portfolio’s investment may become concentrated in a small number of issuers. To the extent that we take large positions in a small number of investments, account returns may fluctuate as a result of changes in the performance of such investments to a greater extent than that of a more diversified account. Returns realized by a client account may be adversely affected if a small number of these investments perform poorly.
Index performance is discussed for illustrative purposes only as a benchmark for each strategy’s performance, and does not predict or depict performance of that strategy. While index comparisons may be useful to provide a benchmark for a strategy’s performance, it must be noted that investments are not limited to the investments comprising the indices. Each of the strategy benchmark indices are unmanaged and cannot be purchased directly by investors. It is not possible to invest in an index.
This message is provided for informational purposes only, reflects our general views on investing and should not be relied upon as recommendations or financial planning advice. We encourage you to seek personalized advice from qualified professionals, including (without limitation) tax professionals, regarding all personal finance issues. While we can counsel on tax efficiency and general tax considerations, MFWM does not (and is not permitted to) provide tax or legal advice. Clients who need such advice should consult tax and legal professionals. This message may not be relied upon as personalized financial planning or tax advice.
MFWM is an SEC registered investment advisor with a fiduciary duty that requires it to act in the best interests of clients and to place the interests of clients before its own. HOWEVER, REGISTRATION AS AN INVESTMENT ADVISOR DOES NOT IMPLY ANY LEVEL OF SKILL OR TRAINING. Access to MFWM is only available to clients pursuant to an Investment Advisory Agreement and acceptance of our Client Relationship Summary and Brochure (Form ADV, Parts 2A and 2B). You are encouraged to read these documents carefully. All investments involve risk and may lose money. MFWM does not guarantee the results of any of its advice or account management. Clients should be aware that their individual account results may not exactly match the performance of any of our Model Portfolios. Past performance is no guarantee of future results. Each Personal Portfolio is subject to an account minimum, which varies based on the strategies included in the portfolio. MFWM retains the right to revise or modify portfolios and strategies if it believes such modifications would be in the best interests of its clients.
During discussions with our Wealth Advisors, they may provide advice with respect to 401(k) and IRA rollovers into accounts that are managed by MFWM. Such recommendations pose potential conflicts of interest in that rolling retirement savings into a MFWM managed account will generate ongoing asset-based fees for MFWM that it would not otherwise receive.
Hedged Equity
Portfolio Managers
JP Bennett, CFAMichael Olsen, CFA
If you were to have sat anyone down at the beginning of this quarter—or the end of November for that matter—and asked them what they thought would happen in Q1 of 2025, we’d venture they wouldn’t have surmised anything close to what’s transpired. To be clear, this is not a political statement, but a very practically-minded hypothesis. If you’d asked anyone whether NATO’s future might fundamentally be in question, an escalating trade war might be a legitimate possibility, the very nature of global alliances and trade might lie in question, they’d likely have discounted it or at very least, they wouldn’t have predicted this exact outcome. That’s not a criticism, so much as it is reality. The future comes at you fast, and those tail events that matter most are often fundamentally unpredictable.
We believe investors’ best defense isn’t to predict better, but to build portfolios composed of businesses endowed with deep competitive advantages, fundamentally able to survive in a broad range of macro environments, and, simply put, built of businesses that matter. In your Hedged Equity SMA, that’s what we’ve tried to do— build a portfolio of enterprises that we think can play offense, and defense, when it matters most.
Against this backdrop, the Hedged Equity SMA returned 0.46% net of fees, versus -2.96% for its benchmark, 70% of the S&P 500. We’re pleased with its performance, and would attribute it to a combination of factors: solid defense from recently tweaked hedges, and strong performance from some of our defensive cash generators (insurance brokers and tower operators). Though we’re long-term investors, we’re pleased with our performance over this relatively short but volatile period.
Lastly, we think some measure of context is in order as we acknowledge recent developments. As long-term investors, we’re optimists. Despite near-term uncertainties, we believe the arc of the world and the general state of affairs is upwards. Financially speaking, we believe the best way to participate in this trend is to own the businesses enabling it.
| QTD | YTD | 1Y | 3Y | 5Y | 10Y | |
|---|---|---|---|---|---|---|
| Hedged Equity | 0.46 | 0.46 | 5.44 | 3.29 | 7.01 | 7.18 |
| Benchmark (70% of the S&P 500) | -2.96 | -2.96 | 5.89 | 6.60 | 13.04 | 8.88 |
On reviewing the past quarter’s performance, the largest contributors, adjusting for weighting and performance, were as follows:
- Brown and Brown: 22.11% return; 6.81% weighting
- Alphabet: -17.87% return; 5.73% weighting
Middle-market insurance broker, and serial tuck-in acquirer, Brown and Brown posted yet another quarter of steady-as-she-goes growth underpinned by a combination of higher insurance rates and share gains along with impressive cash generation—an especially dear quality in an increasingly uncertain market. The market, for its part, rewarded Brown in kind, recognizing the necessity of insurance and the company’s relative insulation from tariffs.
Given a longer view, we remain optimistic about Brown’s prospects. We expect it to sustain consistent mid- to high-single digit growth on a healthy diet of organic growth, tuck-in acquisition, and best-in-class cash generation—it represents a hard-to-replace partner for its small- and mid-size biz clients as it navigates the often complex and hard to understand insurance world. Though shares aren’t exactly cheap, we remain happy owners. We believe Brown to be one of the rare enterprises possessing durable competitive advantages, strong recurring revenue characteristics, durable growth, and a deeply-ingrained culture.
Alphabet, the parent of Google, fell by 17.9% during the quarter. As one of the so-called “Magnificent Seven” stocks, it has still had a nice run over the past two years but has given up a large portion of its gains from 2024. The company has had its share of wins, with YouTube continuing to perform well, and some inroads being made as its AI efforts positively impact both its consumer businesses (Android phones, YouTube, etc.) and enterprise business (Google Cloud Platform).
Offsetting these positives are myriad concerns. Among them: How AI will impact core Google Search; whether Google’s cloud keeps pace with Amazon, Microsoft, and other upstart AI-first companies; and fears of a recession or consumer slowdown’s impact on ad spending, the heart of Alphabet’s cash engine. We share these concerns in the short term, but we believe the company’s success in AI research and the success of YouTube—particularly among the younger generations—position it well.
Portfolio Activity
The bulk of our portfolio activity involved adjusting our hedges, to better mirror the portfolio’s underlying exposures, allow downside protection in periods of market volatility, and more dynamically protect against risk. Specifically, we closed our shorts in individual equities—Helen of Troy, Sunrun, Ziff Davis, Intel Corporation, and SAP—and increased or started shorts in index options—the iShares QQQ Trust, iShares Russell MidCap Growth, and iShares Russell 2000 Growth. In the case of the shorts we started or added to, in particular, we believe they opportunistically should help protect against downside in the portfolio, and lean against what we believe to be pricier corners of the market.
We closed our short positions in Helen of Troy, Intel, Sunrun, and Ziff Davis. Each of these companies underperformed the market over a multi-year period, good for our short positions, but left us with less remaining exposure. The choice became a matter of re-upping the short position, in effect banking on continued underperformance, or closing out the position. We opted to close our shorts.
In our SAP short, it was somewhat different. Our bet was that customers would slowly migrate away from this European company’s legacy offerings, and into a robust and evolving set of tools created by cloud-native companies. SAP proved more resilient than we’d expected. We closed our short position and are moving on.
Concurrent with closing the above shorts, we increased our short position in the Invesco QQQ Trust, which is a fund that tracks the performance of the Nasdaq 100 Index, as a hedge on our overall exposure to U.S. large caps. This market-cap weighted index is very top heavy, has large exposure to cyclical sectors like Tech, and tends to have a higher beta than the broader market, making it in our view an ideal hedge to the long exposures in our portfolio.
We also increased our short position in the iShares Russell Mid-Cap Growth ETF, designed as a hedge on our overall exposure to U.S. mid caps. We have invested in several mid-cap companies that we find attractive, and this ETF represents an effective hedge. Equally, we find that as a broad class, growth stocks are relatively unattractive right now. We believe we have invested in a handful of long positions that are the exception and this hedge tempers our overall exposure.
Last, we opened a new short position in the iShares Russell 2000 Growth ETF—a hedge on our overall exposure to U.S. small caps. In times of economic uncertainty, small cap companies can often have a more difficult time adapting their strategies and remaining afloat. As above, we find that as a broad class, growth stocks are relatively unattractive right now. The trouble is that shorting individual small-cap companies can be risky. Not only are there frequent surprises, but these companies can often be acquired by larger businesses, which would result in a large loss on a short position. By shorting the broader index, we can hedge against the asset class while avoiding that single-stock risk.
The above information is intended solely for current clients of Motley Fool Wealth Management (“MFWM”) for the purpose of providing insight into how we manage our strategies and our investment philosophy. This information should not be disclosed to third parties or duplicated or used for any purpose other than the purpose for which it has been provided.
All information presented herein is for informational purposes only and should not be deemed as investment advice or a recommendation to purchase or sell any specific security. This information reflects the opinions, estimates and projections of MFWM as of the date of publication, which are subject to change without notice. We do not represent that any opinion, estimate or projection will be realized. While we believe this information to be reliable, no representation or warranty is made concerning its accuracy.
Performance results are based on a representative account for each strategy, not individual client accounts. Clients can see their actual account performance on the Interactive Brokers’ website at any time. Client account results may not exactly match the performance of the representative accounts. Such variance is due to a number of factors, including differences in trade prices, transaction fees, market activity, any restrictions have you may have imposed on your account(s), and the amount and the timing of deposits or withdrawals.
The performance information presented herein has been generated during a period of extraordinary market volatility. Accordingly, the performance is not necessarily indicative of results that we may achieve in the future, and we do not represent and it cannot be assumed that the performance of our strategies will be subject to the same economic risk factors that contributed to the above returns. Performance results discussed above represent past performance, which does not guarantee future results. The investment return and principal value of an investment will fluctuate so that current performance may be lower or higher than the performance discussed above. The investment strategy and focus of our model portfolio strategies can change over time. Similarly, there is no assurance that the securities purchased will remain in a model portfolio strategy or that securities sold may not be repurchased. The mention of specific holdings does not constitute a recommendation by MFWM or its affiliates.
To the extent we invest more heavily in particular sectors or industries of the economy, the performance of our strategies will be especially sensitive to developments that significantly affect those sectors or industries. While investing in a particular sector is not a principal investment strategy of any model portfolio, client portfolios may be significantly invested in a sector or industry as a result of our portfolio management decisions. Similarly, a model portfolio’s investment may become concentrated in a small number of issuers. To the extent that we take large positions in a small number of investments, account returns may fluctuate as a result of changes in the performance of such investments to a greater extent than that of a more diversified account. Returns realized by a client account may be adversely affected if a small number of these investments perform poorly.
Index performance is discussed for illustrative purposes only as a benchmark for each strategy’s performance, and does not predict or depict performance of that strategy. While index comparisons may be useful to provide a benchmark for a strategy’s performance, it must be noted that investments are not limited to the investments comprising the indices. Each of the strategy benchmark indices are unmanaged and cannot be purchased directly by investors. It is not possible to invest in an index.
This message is provided for informational purposes only, reflects our general views on investing and should not be relied upon as recommendations or financial planning advice. We encourage you to seek personalized advice from qualified professionals, including (without limitation) tax professionals, regarding all personal finance issues. While we can counsel on tax efficiency and general tax considerations, MFWM does not (and is not permitted to) provide tax or legal advice. Clients who need such advice should consult tax and legal professionals. This message may not be relied upon as personalized financial planning or tax advice.
MFWM is an SEC registered investment advisor with a fiduciary duty that requires it to act in the best interests of clients and to place the interests of clients before its own. HOWEVER, REGISTRATION AS AN INVESTMENT ADVISOR DOES NOT IMPLY ANY LEVEL OF SKILL OR TRAINING. Access to MFWM is only available to clients pursuant to an Investment Advisory Agreement and acceptance of our Client Relationship Summary and Brochure (Form ADV, Parts 2A and 2B). You are encouraged to read these documents carefully. All investments involve risk and may lose money. MFWM does not guarantee the results of any of its advice or account management. Clients should be aware that their individual account results may not exactly match the performance of any of our Model Portfolios. Past performance is no guarantee of future results. Each Personal Portfolio is subject to an account minimum, which varies based on the strategies included in the portfolio. MFWM retains the right to revise or modify portfolios and strategies if it believes such modifications would be in the best interests of its clients.
During discussions with our Wealth Advisors, they may provide advice with respect to 401(k) and IRA rollovers into accounts that are managed by MFWM. Such recommendations pose potential conflicts of interest in that rolling retirement savings into a MFWM managed account will generate ongoing asset-based fees for MFWM that it would not otherwise receive.
Large Cap Aggressive Growth
Portfolio Managers
Tony Arsta, CFAJeremy Myers, CFA
The Aggressive Growth strategy experienced a bit of a whipsaw to end the quarter. After solid gains to start the year, the sell-off in mega-cap technology stocks was too much to overcome, causing returns to dip below the benchmark in the final days of March. During the first quarter, the Large Cap Aggressive Growth strategy posted a -5.65% return net of fees versus a -4.27% return for its benchmark, the S&P 500®.
Considering the recent chaos in the market and the high-volatility nature of the Aggressive Growth strategy, we expect this year to remain a bumpy ride. The Magnificent Seven stocks are officially in a bear market after collectively falling 20% from their peak. We’ve avoided a couple of the biggest decliners in the group, Nvidia and Tesla, but we hold large positions in Alphabet, Amazon, and Meta Holdings, all of which experienced greater than 15% drawdowns during the quarter. AI-related stocks also declined during the quarter following revelations that Chinese startup DeepSeek was able to match or best many of the leading LLMs at a tiny fraction of the cost. As a result, investors became increasingly skeptical of the massive capital spending on the data centers and questioned where generative AI is becoming commoditized.
Collectively, it seems to us that we could be entering a “risk-off” environment and multiples for growth stocks in particular are contracting. Value strategies significantly outperformed growth during the quarter as investors fled to safety. If the economy continues to slow, it’s reasonable to expect that trend may continue in the near term. We slightly raised our cash position during the quarter and expect to reallocate to more attractive opportunities should the market sell-off continue. In the interim, we feel confident that the quality of the businesses we own should ultimately be recognized by the market and help protect from an extended drawdown while minimizing volatility. Though it doesn’t feel good to experience this level of volatility in the short-term, it’s a necessary evil to generate higher returns over time. In our view, investors that can keep a level head and stick to their strategy during these periods often tend to be more successful in the long-run.
| QTD | YTD | 1Y | 3Y | 5Y | 10Y | |
|---|---|---|---|---|---|---|
| US Large Cap Aggressive Growth | -5.65 | -5.65 | 3.17 | 7.11 | 14.79 | 11.84 |
| Benchmark (S&P 500) | -4.27 | -4.27 | 8.28 | 9.07 | 18.60 | 12.51 |
Factoring in size and performance, the portfolio’s largest contributor, and largest detractor, were as follows:
- MercadoLibre: 14.73% return; 7.21% weighting
- Salesforce: -19.73% return; 6.63% weighting
Latin American e-commerce and payments giant Mercado Libre eked out decent gains on the strength of continued superlative growth in its e-commerce, payments, and still-nascent and growing lending business. The company has continued to post impressive profitability, despite aggressive growth within its lending business. The market, for its part, took note and rewarded MELI. Taking a longer view, we continue to believe that MELI should have years of outstanding growth ahead with ongoing e-commerce penetration in Latin America’s comparatively immature markets, deeper penetration of its financial service offerings, and improving profitability as the business continues to scale. While shares aren’t cheap, we remain happy owners.
Salesforce finished 2024 with steady growth and improving margins, but that performance didn’t protect the stock from a negative sentiment shift toward AI-related companies. CEO Marc Benioff continues to promote the company’s new Agentforce (agentic AI) products as a new paradigm and a massive opportunity for Salesforce. Early indications are that demand is strong, with over 5,000 deals closed since October. Despite the early success, the emergence of DeepSeek, a China-based AI start-up, reminded everyone of the disruptive forces that still exist in the technology industry. As a result, Salesforce’s stock traded down steadily through the second half of the quarter, ending up with losses in line with many of its mega cap peers with similar AI exposure. Longer-term, we still think that Salesforce is among the best positioned companies to profit from AI adoption and that improved cost discipline should continue to drive margins – and possibly the stock price – higher.
Transactions
During the quarter we sold our position in CrowdStrike. The stock has rallied strongly since our August purchase when we took advantage of a self-inflicted error that caused investors to dump shares. Not only has the business bounced back, but the stock was once again trading at a huge premium at nearly 19-times estimated 2025 sales. Considering the recent volatility in the market, we thought it made sense to trim a richly valued position to be able to take advantage of similar opportunities, should they appear.
We also sold our position in Moderna following a string of negative developments. First, the company’s recently launched RSV vaccine failed to meet expectations, forcing management to eliminate multiple development programs to cut costs. More recently, management lowered revenue expectations again thanks to a milder Covid season than previous years, resulting in lower demand for its Spikevax vaccine. Also, it appears that the new administration is likely to cut funding for healthcare in general and it will likely take a more negative stance toward vaccine research. Moderna’s development programs have the potential to create multiple long-term winners, but it will require a huge amount of spending to get them across the finish line. With diminished cash flow streams going forward, that path looks more tenuous than when we originally purchased shares. We have decided to take our lumps and reallocate to other higher confidence positions.
The above information is intended solely for current clients of Motley Fool Wealth Management (“MFWM”) for the purpose of providing insight into how we manage our strategies and our investment philosophy. This information should not be disclosed to third parties or duplicated or used for any purpose other than the purpose for which it has been provided.
All information presented herein is for informational purposes only and should not be deemed as investment advice or a recommendation to purchase or sell any specific security. This information reflects the opinions, estimates and projections of MFWM as of the date of publication, which are subject to change without notice. We do not represent that any opinion, estimate or projection will be realized. While we believe this information to be reliable, no representation or warranty is made concerning its accuracy.
Performance results are based on a representative account for each strategy, not individual client accounts. Clients can see their actual account performance on the Interactive Brokers’ website at any time. Client account results may not exactly match the performance of the representative accounts. Such variance is due to a number of factors, including differences in trade prices, transaction fees, market activity, any restrictions have you may have imposed on your account(s), and the amount and the timing of deposits or withdrawals.
The performance information presented herein has been generated during a period of extraordinary market volatility. Accordingly, the performance is not necessarily indicative of results that we may achieve in the future, and we do not represent and it cannot be assumed that the performance of our strategies will be subject to the same economic risk factors that contributed to the above returns. Performance results discussed above represent past performance, which does not guarantee future results. The investment return and principal value of an investment will fluctuate so that current performance may be lower or higher than the performance discussed above. The investment strategy and focus of our model portfolio strategies can change over time. Similarly, there is no assurance that the securities purchased will remain in a model portfolio strategy or that securities sold may not be repurchased. The mention of specific holdings does not constitute a recommendation by MFWM or its affiliates.
To the extent we invest more heavily in particular sectors or industries of the economy, the performance of our strategies will be especially sensitive to developments that significantly affect those sectors or industries. While investing in a particular sector is not a principal investment strategy of any model portfolio, client portfolios may be significantly invested in a sector or industry as a result of our portfolio management decisions. Similarly, a model portfolio’s investment may become concentrated in a small number of issuers. To the extent that we take large positions in a small number of investments, account returns may fluctuate as a result of changes in the performance of such investments to a greater extent than that of a more diversified account. Returns realized by a client account may be adversely affected if a small number of these investments perform poorly.
Index performance is discussed for illustrative purposes only as a benchmark for each strategy’s performance, and does not predict or depict performance of that strategy. While index comparisons may be useful to provide a benchmark for a strategy’s performance, it must be noted that investments are not limited to the investments comprising the indices. Each of the strategy benchmark indices are unmanaged and cannot be purchased directly by investors. It is not possible to invest in an index.
This message is provided for informational purposes only, reflects our general views on investing and should not be relied upon as recommendations or financial planning advice. We encourage you to seek personalized advice from qualified professionals, including (without limitation) tax professionals, regarding all personal finance issues. While we can counsel on tax efficiency and general tax considerations, MFWM does not (and is not permitted to) provide tax or legal advice. Clients who need such advice should consult tax and legal professionals. This message may not be relied upon as personalized financial planning or tax advice.
MFWM is an SEC registered investment advisor with a fiduciary duty that requires it to act in the best interests of clients and to place the interests of clients before its own. HOWEVER, REGISTRATION AS AN INVESTMENT ADVISOR DOES NOT IMPLY ANY LEVEL OF SKILL OR TRAINING. Access to MFWM is only available to clients pursuant to an Investment Advisory Agreement and acceptance of our Client Relationship Summary and Brochure (Form ADV, Parts 2A and 2B). You are encouraged to read these documents carefully. All investments involve risk and may lose money. MFWM does not guarantee the results of any of its advice or account management. Clients should be aware that their individual account results may not exactly match the performance of any of our Model Portfolios. Past performance is no guarantee of future results. Each Personal Portfolio is subject to an account minimum, which varies based on the strategies included in the portfolio. MFWM retains the right to revise or modify portfolios and strategies if it believes such modifications would be in the best interests of its clients.
During discussions with our Wealth Advisors, they may provide advice with respect to 401(k) and IRA rollovers into accounts that are managed by MFWM. Such recommendations pose potential conflicts of interest in that rolling retirement savings into a MFWM managed account will generate ongoing asset-based fees for MFWM that it would not otherwise receive.
Small & Mid-Cap
Portfolio Managers
Tony Arsta, CFANate Weisshaar, CFA
Usually, we’re quite happy when we outperform our benchmark by more than three percentage points in a single quarter. But we’re less happy when that means that the U.S. Small and Mid Cap SMA strategy still declined by -2.7% during the quarter.
Investors can place much of the blame for the weak performance of small- and mid-cap stocks in Q1 on the actions of the federal government. A combination of rising tariffs, the expectation that other countries will retaliate to our tariffs, the haphazard gutting of the federal workforce, and threats of territorial expansion towards Canada and Greenland has created an environment of uncertainty and volatility. We are frankly skeptical that there is a method to the madness. But if there is one, perhaps it is towards Treasury Secretary Scott Bessent’s statements to the media in February that the administration wants lower long-term interest rates.
Putting the brakes on the economy through tariffs and cutting government spending seems to be their strategy for achieving that aim. The administration is willing to put the economy through what it views as near-term pain for the sake of a restructured American economy and the presumed benefits that would come with it. The market’s focus right now, however, is the increasing likelihood of a recession this year. The Atlanta Fed’s real-time estimate of GDP growth, GDPNow, is forecasting a Q1 economic contraction of 1.4% (adjusting for the impact of gold imports and exports).
Complicating matters is that expectations for inflation ticked up in February to 3.1%. If inflation does creep back up, and let’s note that tariffs directly increase prices paid by consumers, Fed bankers acknowledge the central bank may find itself hard pressed to lower rates to provide support to a weakening economy.
We acknowledge the uncertainty of the economic environment and expect that as Q1 earnings are released in the coming weeks there could be downward revisions in earnings guidance. We also note that the market is typically forward-looking and may have already priced in potential future negativity. Regardless, we remain focused on owning what we believe to be high-quality businesses for the long term. One thing we like about owning companies that are leaders in their niche is that they often get the opportunity to play offense during hard times and extend their competitive advantages over weaker peers. We also like that valuations can be more attractive in a down market and this may give us the opportunity to add some new positions to the SMA that have been on our radar for some time.
| QTD | YTD | 1Y | 3Y | 5Y | 10Y | |
|---|---|---|---|---|---|---|
| US Small and Mid-Cap | -2.71 | -2.71 | 11.59 | 4.65 | 12.79 | 6.62 |
| Benchmark (S&P Midcap 400) | -6.10 | -6.10 | -2.84 | 4.38 | 16.88 | 8.41 |
Factoring in size and performance, the portfolio’s largest contributor and largest detractor were as follows:
- Inari Medical: 56.65% return, 1.85% average weight
- Herc Holdings: -24.61% return, 3.39% average weight
Our top performer was no longer in our portfolio by quarter-end; in fact it was no longer publicly traded by quarter-end. On January 6, Stryker announced that it was acquiring medical device company Inari Medical for $80 per share, a 60.7% premium to the previous closing price of $49.77. The acquisition closed on February 19 and the SMA’s shares of Inari were exchanged for cash.
Herc Holdings, one of the top three heavy equipment rental companies (think people lifters, fork lifts, and earthmovers) in the country, is one of our newer holdings. With shares down 28.8%, the first quarter of 2025 wasn’t exactly what we were expecting or hoping for when we originally bought shares. While consolidation in the industry is core to our investment thesis, we (and seemingly most investors) were surprised to see Herc outbid United Rentals—the 800lb gorilla in the market—for the fourth largest player, H&E Equipment Services. We were expecting Herc to take smaller bites in its pursuit of growth through both organic investment and acquisition, so this relatively large chomp raises some short-term concerns in terms of digestion and balance sheet impacts, particularly if the US economy and construction industry struggle. However, by using what we considered to be fairly richly valued shares in Herc as ~25% of the payment, it mitigates some of the balance sheet risk and demonstrates capital allocation skill. Long-term, we still like Herc and the broader equipment rental industry. So we’re viewing the recent share price moves as a temporary bump on the road to realizing our thesis.
Portfolio Changes
As mentioned above, Inari Medical was acquired away from us during the quarter. We also purchased shares of two new companies this quarter.
Fabrinet is a contract manufacturer focused on opto-electronics – the devices that generate and receive lasers that are carried through fiber optic cables. Unlike other contract manufacturers, the company has strategically chosen to focus on low-to-medium volume, high mix, technically challenging products. This keeps their customers coming back to them over the long run. Historically, this has made telecom network suppliers their most important customers, but with the AI boom, companies like Nvidia are some of their largest customers. We initiated our position following market weakness when an open-source AI model from China called “DeepSeek” released performance metrics that were quite impressive despite being developed on lower-cost equipment. Fabrinet’s stock price was hit hard, as were the shares of other AI hardware businesses. We continue to hold to a few beliefs that made us interested in this opportunity. First, the development and training of AI models was always likely to move down the cost curve, as computing developments usually do. Second, the demand for increasing computing performance among the largest and wealthiest developers works in conjunction with current abilities becoming cheaper to produce. Third, even if the market was overoptimistic about Nvidia’s potential, Fabrinet still will keep busy producing components for them and their other customers. Given these beliefs, we did not view the decline in Fabrinet’s share price as justified, and we were willing to take the opportunity to add shares at a lower valuation than was previously available.
Our other new purchase was Alphatec, a medical device company focused on developing technologies used in spine surgery. In late 2017, former NuVasive executives took over the company and set it on its current path (NuVasive was also a medical device company in the spine surgery space that was acquired by U.S. Small- and Mid-Cap SMA holding Globus Medical in September 2023). Alphatec’s approach to spinal surgeries, which need to be re-done disproportionately more than other surgeries, is to use best-in-class imaging and navigation to deliver the best patient outcomes. Alphatec has taken their business from around $90 million in revenue in 2018 to over $600 million in 2024, bringing their market share up to an estimated 8%. The company should benefit from scale as they continue to grow. This will help them cover their current cost structure, but also allow them to sell even more into an existing user base as they aim to continue innovating and launch 8-10 new products per year. If they execute, the potential upside over the next 3-5 years could be quite exciting.
Along with these position changes, we also made a few smaller trades in the quarter. We trimmed our stake in Globus Medical. The stock had performed well, and we recycled the proceeds into our Alphatec investment. These two companies are both device makers focusing on spinal surgery. We like both investments but wanted to be mindful of our overall exposure to such a specific niche of the Health Care sector.
We also used the excess cash we had after these moves and the Inari acquisition to take a bigger stake in a few of our existing positions. We added to Crocs. We may not be enamored with the look of their trademark shoes, but we find the free cash flow generated by the makers of rubber shoes absolutely irresistible. We believe management knows how to drive this brand (and the currently struggling Hey Dude brand), which should continue driving the share price higher. We also added to Live Oak Bank, which is often viewed as a proxy for small businesses in the US. With growing concerns about a recession, its shares have been beaten down. While we admit Live Oak can't sidestep a broad economic slowdown (no bank can), we believe the negative sentiment around the stock is overdone. Recessions are a part of the economic cycle and we believe this management team has the discipline to protect the balance sheet while still investing for growth on the other side of whatever economic pains may lie ahead.
The above information is intended solely for current clients of Motley Fool Wealth Management (“MFWM”) for the purpose of providing insight into how we manage our strategies and our investment philosophy. This information should not be disclosed to third parties or duplicated or used for any purpose other than the purpose for which it has been provided.
All information presented herein is for informational purposes only and should not be deemed as investment advice or a recommendation to purchase or sell any specific security. This information reflects the opinions, estimates and projections of MFWM as of the date of publication, which are subject to change without notice. We do not represent that any opinion, estimate or projection will be realized. While we believe this information to be reliable, no representation or warranty is made concerning its accuracy.
Performance results are based on a representative account for each strategy, not individual client accounts. Clients can see their actual account performance on the Interactive Brokers’ website at any time. Client account results may not exactly match the performance of the representative accounts. Such variance is due to a number of factors, including differences in trade prices, transaction fees, market activity, any restrictions have you may have imposed on your account(s), and the amount and the timing of deposits or withdrawals.
The performance information presented herein has been generated during a period of extraordinary market volatility. Accordingly, the performance is not necessarily indicative of results that we may achieve in the future, and we do not represent and it cannot be assumed that the performance of our strategies will be subject to the same economic risk factors that contributed to the above returns. Performance results discussed above represent past performance, which does not guarantee future results. The investment return and principal value of an investment will fluctuate so that current performance may be lower or higher than the performance discussed above. The investment strategy and focus of our model portfolio strategies can change over time. Similarly, there is no assurance that the securities purchased will remain in a model portfolio strategy or that securities sold may not be repurchased. The mention of specific holdings does not constitute a recommendation by MFWM or its affiliates.
To the extent we invest more heavily in particular sectors or industries of the economy, the performance of our strategies will be especially sensitive to developments that significantly affect those sectors or industries. While investing in a particular sector is not a principal investment strategy of any model portfolio, client portfolios may be significantly invested in a sector or industry as a result of our portfolio management decisions. Similarly, a model portfolio’s investment may become concentrated in a small number of issuers. To the extent that we take large positions in a small number of investments, account returns may fluctuate as a result of changes in the performance of such investments to a greater extent than that of a more diversified account. Returns realized by a client account may be adversely affected if a small number of these investments perform poorly.
Index performance is discussed for illustrative purposes only as a benchmark for each strategy’s performance, and does not predict or depict performance of that strategy. While index comparisons may be useful to provide a benchmark for a strategy’s performance, it must be noted that investments are not limited to the investments comprising the indices. Each of the strategy benchmark indices are unmanaged and cannot be purchased directly by investors. It is not possible to invest in an index.
This message is provided for informational purposes only, reflects our general views on investing and should not be relied upon as recommendations or financial planning advice. We encourage you to seek personalized advice from qualified professionals, including (without limitation) tax professionals, regarding all personal finance issues. While we can counsel on tax efficiency and general tax considerations, MFWM does not (and is not permitted to) provide tax or legal advice. Clients who need such advice should consult tax and legal professionals. This message may not be relied upon as personalized financial planning or tax advice.
MFWM is an SEC registered investment advisor with a fiduciary duty that requires it to act in the best interests of clients and to place the interests of clients before its own. HOWEVER, REGISTRATION AS AN INVESTMENT ADVISOR DOES NOT IMPLY ANY LEVEL OF SKILL OR TRAINING. Access to MFWM is only available to clients pursuant to an Investment Advisory Agreement and acceptance of our Client Relationship Summary and Brochure (Form ADV, Parts 2A and 2B). You are encouraged to read these documents carefully. All investments involve risk and may lose money. MFWM does not guarantee the results of any of its advice or account management. Clients should be aware that their individual account results may not exactly match the performance of any of our Model Portfolios. Past performance is no guarantee of future results. Each Personal Portfolio is subject to an account minimum, which varies based on the strategies included in the portfolio. MFWM retains the right to revise or modify portfolios and strategies if it believes such modifications would be in the best interests of its clients.
During discussions with our Wealth Advisors, they may provide advice with respect to 401(k) and IRA rollovers into accounts that are managed by MFWM. Such recommendations pose potential conflicts of interest in that rolling retirement savings into a MFWM managed account will generate ongoing asset-based fees for MFWM that it would not otherwise receive.
US Stock Markets
The US Stock Markets commentary includes the following holdings: US Large Cap Strategy (Vanguard S&P 500 ETF: VOO, US Mid Cap Strategy (Vanguard Mid-Cap ETF: VO), and US Small Cap Strategy (Vanguard Small-Cap ETF: VB)
U.S. Stock Markets were down more than -4% on average for the quarter with the US Large Cap Strategy (“Large Cap”), which holds VOO, down roughly -4.3% net of ETF expenses, excluding account level fees and expenses, during the period. Mid-Caps outperformed the broad market and the Small Cap strategy this quarter. The Mid Cap Strategy (“Mid Cap”), which holds VO, lost just -1.6% net of ETF expenses, excluding account level fees and expenses, during the period. Small-Caps lagged Mid-Caps, with the Small-Cap Strategy (“Small Cap”), which holds VB, down -7.3%, net of ETF expenses, excluding account level fees and expenses. In general, Large Cap equity performance was roughly in line with the broader market, with the Russell 1000 down about -4.5% in Q1. In a reversal from Q4, Technology and Consumer Cyclical stocks significantly lagged the broader market. Bright spots came from Energy, Healthcare, Utilities, and Consumer Defensives. Conversely, Communications, and Industrials detracted from performance. Value markedly outperformed Growth and the broad market during the quarter, as did higher-dividend yielding stocks.
International Stock Markets
The International Stock Markets commentary includes the following holdings: International Developed Strategy (Vanguard FTSE Developed Markets ETF: VEA) and International Emerging Markets Strategy (Vanguard Emerging Markets ETF: VWO).
The Emerging Markets Strategy, which holds VWO, underperformed compared to the Developed Markets strategy, which holds VEA, gaining just shy of 2.9% and 6.8% net of ETF expenses, excluding account level fees and expenses, during Q1, respectively. The significant breadth of positive performance across all but two sectors in The Developed Markets Strategy propelled the robust result. Financials, Utilities, and Energy performed especially well. The Emerging Markets strategy performance was more concentrated, with strength coming primarily from Communication Services and Consumer Discretionary, followed by Materials and Financials.
US Real Estate
The US Real Estate commentary refers to the Real Estate Investment Trusts Strategy (Vanguard REIT ETF: VNQ)
The Real Estate Strategy, which holds VNQ, had a relatively strong quarter against U.S. Stocks. Cellular Tower REITs drove performance, with some contribution from logistics. The Real Estate strategy delivered a performance of roughly 2.7%, net of ETF expenses, excluding account level fees and expenses, in Q1.
Fixed Income
The Fixed Income commentary refers to the following holdings: US Bonds Strategy (Vanguard Total Bond Market ETF: BND), Treasury Inflation-Protected Securities Strategy (Vanguard Short-Term Inflation-Protected Securities ETF: VTIP), and, for taxable accounts only, US Muni Bonds Strategy (iShares National Muni Bond ETF: MUB).
U.S. Bond markets were also positive in the quarter, with core bonds outperforming the U.S. Equity market. The US Bond Strategy, which holds BND, posted a gain just shy of 2.8% for the quarter, net of ETF expenses, excluding account level fees and expenses. Long duration outperformed shorter- and intermediate-duration maturities during the quarter. High Yield was comparatively soft, while TIPS outperformed all but long term treasuries within broader fixed income. The TIPS Strategy, which holds VTIP, posted a 3.1% gain, net of ETF expenses, excluding account level fees and expenses in Q1. The Municipal Bonds strategy, which holds MUB, was down modestly, losing -0.5%, net of ETF expenses, excluding account level fees and expenses.
The above information is intended solely for current clients of Motley Fool Wealth Management ("MFWM") for the purpose of providing insight into how we manage our strategies and our investment philosophy. This information should not be disclosed to third parties or duplicated or used for any purpose other than the purpose for which it has been provided.
PLEASE NOTE that the performance results, presented for the passive strategies/index ETFs, do not represent the performance of MFWM’s discretionary management decisions, nor does it reflect the management fee charged by Fool Wealth to manage client accounts. Third party ETFs in which we invest client assets are subject to fees and expenses (“Underlying Fund Fees”) that are separate from (and in addition to) Fool Wealth’s management fee. These Underlying Fund Fees are passed along to clients. Depending on the strategy, Underlying Fund Fees may be significant. Fool Wealth’s management fees reduce the rate of return on investments. Details of Fool Wealth’s fees for index-based portfolios can be found in Item 5(A) (1)(a) of our Brochure (“Form ADV Part 2A”).
The exchange traded funds (“ETFs”) that Fool Wealth utilizes in our index-based portfolio program are managed by third party fund managers (such as Vanguard and BlackRock) unaffiliated with Fool Wealth, TMF or our affiliates. Third party ETF managers do not pay MFWM or our affiliates any transaction-based compensation (or any other type of fee or payment) in connection with the purchase of their ETFs by Fool Wealth clients. However, clients pay transaction fees (e.g., brokerage commissions) in connection with the purchase and sale of ETFs, and may pay to their custodian account fees and other miscellaneous charges.
The performance and other information included herein were calculated by third parties. While these third parties are reputable and we believe that the information is accurate, we have not independently verified the information.
All information presented herein is for informational purposes only and should not be deemed as investment advice or a recommendation to purchase or sell any specific security. This information reflects the opinions, estimates and projections of MFWM as of the date of publication, which are subject to change without notice. We do not represent that any opinion, estimate or projection will be realized. While we believe this information to be reliable, no representation or warranty is made concerning its accuracy.