Portfolio Manager Commentary Q1 '26
Contents
Dear Client,

Tony Arsta, CFA
Chief Investment Officer, Motley Fool Wealth Management
Farewells are never easy, but I hope you will rest assured that we are leaving you in excellent hands with the investing team led by CIO Eric Sterner at Apollon, whom I personally trust to steward your resources with your best interests at the forefront. True to Foolish form—Apollon provides clear, timely market commentary to help you stay well-informed and well-positioned, whatever markets throw our way in the future.
This past quarter had two distinct periods of disruption. In January and February, many software stocks fell sharply as questions around AI’s impact weighed on previously high valuations. Even so, the S&P 500 was essentially flat through the first two months. Then, in March, markets slipped more than 4% as events in Iran added uncertainty around geopolitical risk and inflation.
While headlines focused on the Fed’s rate decisions and AI’s impact on jobs and software, investor positioning felt like a tug‑of‑war. The data itself was mixed—February’s payroll decline was followed by a sharp rebound in March, making short‑term trading especially difficult and reinforcing our preference for strategic discipline over market prediction.
We’ve seen some rotation out of prior winners. For example, Microsoft—a member of the “Magnificent 7”—declined more than 20% during the quarter after a strong prior year, reflecting to us uncertainty about AI’s ultimate winners, the pace of displacement, and the substantial capital spending underway. In this volatility, our approach was unchanged: concentrate on quality businesses, keep valuation and durability front and center, and let short‑term swings play out. Our definition of “quality” evolves with new information, but our core beliefs do not.
A further sign of this rotation: the S&P 500 Equal Weight index had a positive quarter while growth stocks broadly lagged as many investors appeared to reduce risk exposure in March. Software was particularly weak (the iShares Expanded Tech‑Software ETF declined over 24%) amid a narrative that AI could displace many of these businesses or at least reduce user‑based revenues. We’re tracking this trend closely, sorting software companies into different groups based on categories such as “systems of record” or “workflow acceleration” to identify where switching costs, mission‑criticality, and pricing power remain intact. While we can’t predict the future, periods of indiscriminate selling have historically created selective opportunities for disciplined investors.
In the same ballpark, private credit lenders are getting hit hard. At first glance, this may seem unrelated to the above discussion, but software companies represent a meaningful share of private credit loans, and limited redemption liquidity can amplify pressure when concerns rise. As ever, leverage and illiquidity reduce an investor’s control over timing. We prefer to maintain that control.
Turning to geopolitics, the human toll in Iran is foremost. There are so many lives affected, and it feels trivial to discuss the economic impact, but that is my role for you. From a market standpoint, higher oil prices and potential supply dislocations (including products that move through the Strait of Hormuz, like certain fertilizers) have fed inflation worries. Our view remains long‑term: input‑cost volatility matters, but over multi‑year horizons historically it has tended to be one factor among many in business value creation.
Until tensions ease, markets may behave unusually. Gold and bonds—assets that often diversify equities—both fell as inflation concerns grew. With debates about rate cuts giving way to questions about possible hikes if inflation runs hot, traditional “ballasts” have been less effective, making drawdowns feel even worse. Even so, forced selling across “good and bad” assets can set the stage for future opportunity. We’re focused on owning what we believe are resilient businesses at sensible prices and on prudent portfolio upgrades where warranted. This current market environment—like all the others before it—shall pass.
Thank you for your trust during your time with us at Fool Wealth. Stay Foolish!
Sincerely,
Tony Arsta, CFA
Chief Investment Officer
Motley Fool Wealth Management
Effective April 1, 2026, Motley Fool Wealth Management (“MFWM”) has joined Apollon Wealth Management, LLC (“Apollon”). As part of the process of transitioning client accounts to Apollon’s management, MFWM has engaged Apollon as a sub-adviser during the transition process. For those clients who have entered into new advisory agreements with Apollon, MFWM will continue to act as their adviser, supported by Apollon, until their accounts are successfully migrated to Apollon’s management platform, at which time Apollon will take over as their investment adviser. Following such transition, MFWM may provide additional transition-related services to their account as a sub-adviser.
The above information and the following Quarterly Performance Report (“Report”) are intended solely for current clients of Motley Fool Wealth Management (“MFWM”) for the purpose of providing insight into how we manage our strategies and our investment philosophy. This information should not be disclosed to third parties or duplicated or used for any purpose other than the purpose for which it has been provided.
Similarly, all information presented herein is for informational purposes only and should not be deemed as investment advice or a recommendation to purchase or sell any specific security. This information reflects the opinions, estimates and projections of MFWM as of the date of publication, which are subject to change without notice.
Performance results discussed in the Report represent past performance, which does not guarantee future results. The performance information presented herein includes information describing certain periods of extreme market conditions, and such results should not be considered repeatable in future periods. The investment return and principal value of an investment will fluctuate so that current performance may be lower or higher than the performance discussed in the Report.
Large Cap Dividend
Portfolio Managers
Tony Arsta, CFAJeremy Myers, CFA
The first quarter was the type of market that the low-volatility Dividend strategy was built for. As uncertainty increased thanks to worries about AI disruption and an intensifying conflict with Iran, investors pulled back on risk, causing value stocks to outperform many of the high-flying growth stocks from the previous year. During the first quarter, the Dividend strategy posted a 0.79% return, net of fees, versus a -4.33% return for its benchmark, the S&P 500®.
The most notable change during the quarter was the rotation away from many of the technology companies that were outperformers in 2025 and strong performance by the energy, materials, and industrials sectors. Thanks to new developments in agentic AI, software companies sold off, while companies supplying the infrastructure for AI data centers continued to gain. Other asset-light industries like financial data services and insurance brokers, which have long been considered to have impenetrable moats, saw their stock prices slashed over worries about their long-term viability.
In response, investors have embraced a new investment strategy that goes by the acronym HALO (High-asset, Low-obsolescence) to pick the companies least likely to be disrupted by AI. Fortunately for us, these HALO companies are many of the slower-growing, but dependable, cash-generative businesses that populate the Dividend portfolio. Not only do investors believe these businesses will be difficult for AI models to replicate, but they also could stand to benefit from potential cost savings from AI automation. That said, a rapid rise in inflation and interest rates would cut into those gains as most asset-heavy companies also have debt-heavy balance sheets. We try to stick to companies that employ modest amounts of leverage, but as we’ve seen with software stocks, if investors get spooked, they could just sell the entire sector and ask questions later.
If the first quarter is indicative of what’s in store for 2026, we’re expecting a lot more bumps along the way. In these volatile times, we try to maintain focus on our disciplined approach to investing only in high-quality businesses with exceptional management teams and durable competitive advantages. Though this approach has been out of favor over the past year, the tide appears to be turning, and we remain confident that companies with predictable revenue, high profitability, and strong cash flow should perform well over the full economic cycle.
| QTD | YTD | 1Y | 3Y | 5Y | |
|---|---|---|---|---|---|
| US Large Cap Dividend | 0.79 | 0.79 | 4.31 | 7.41 | 4.86 |
| Benchmark (S&P 500) | -4.33 | -4.33 | 17.80 | 18.32 | 12.07 |
Factoring in position size and performance, the portfolio’s largest contributor and detractor were as follows:
- Equinix: 28.63% return; 5.96% weighting
- Microsoft: -23.28% return; 6.05% weighting
We believe Equinix’s strong quarter is largely attributable to better-than-expected forward guidance as the company is seeing improving demand for its data center services. The stock sputtered in 2025 after management announced increased capex spending to fuel the rapid growth in compute demand from AI companies. That forecasted demand is beginning to show up in Equinix’s bookings, which are expected to accelerate through the end of the year. Longer-term we think Equinix is well-positioned as AI companies shift from training models to more distributed inference applications that require proximity to end users to minimize latency.
Just to give an idea of how negative investor sentiment has turned toward the software industry, Microsoft just posted its worst quarterly stock performance since the Great Recession.1Despite strong underlying business fundamentals, three converging concerns emerged: massive AI infrastructure spending with uncertain near-term returns, Azure cloud growth deceleration, and disappointing Copilot adoption rates. It’s unlikely that these issues will resolve in the next few quarters, but we still think Microsoft is one of the best positioned of the hyperscalers to capture demand for computing from outsides customers while also find profitable ways to monetize new AI capabilities across its own product portfolio. It’s also trading at one of the cheapest valuations relative to the market in the past several years.
Transactions
There were no transactions during the quarter.
The above information is intended solely for current clients of Motley Fool Wealth Management (“MFWM”) for the purpose of providing insight into how we manage our strategies and our investment philosophy. This information should not be disclosed to third parties or duplicated or used for any purpose other than the purpose for which it has been provided.
All information presented herein is for informational purposes only and should not be deemed as investment advice or a recommendation to purchase or sell any specific security. This information reflects the opinions, estimates and projections of MFWM as of the date of publication, which are subject to change without notice. We do not represent that any opinion, estimate or projection will be realized. While we believe this information to be reliable, no representation or warranty is made concerning its accuracy.
Performance results are based on a representative account for each strategy, not individual client accounts. Clients can see their actual account performance on the Interactive Brokers’ website at any time. Client account results may not exactly match the performance of the representative accounts. Such variance is due to a number of factors, including differences in trade prices, transaction fees, market activity, any restrictions have you may have imposed on your account(s), and the amount and the timing of deposits or withdrawals.
The performance information presented herein has been generated during a period of extraordinary market volatility. Accordingly, the performance is not necessarily indicative of results that we may achieve in the future, and we do not represent and it cannot be assumed that the performance of our strategies will be subject to the same economic risk factors that contributed to the above returns. Performance results discussed above represent past performance, which does not guarantee future results. The investment return and principal value of an investment will fluctuate so that current performance may be lower or higher than the performance discussed above. The investment strategy and focus of our model portfolio strategies can change over time. Similarly, there is no assurance that the securities purchased will remain in a model portfolio strategy or that securities sold may not be repurchased. The mention of specific holdings does not constitute a recommendation by MFWM or its affiliates.
To the extent we invest more heavily in particular sectors or industries of the economy, the performance of our strategies will be especially sensitive to developments that significantly affect those sectors or industries. While investing in a particular sector is not a principal investment strategy of any model portfolio, client portfolios may be significantly invested in a sector or industry as a result of our portfolio management decisions. Similarly, a model portfolio’s investment may become concentrated in a small number of issuers. To the extent that we take large positions in a small number of investments, account returns may fluctuate as a result of changes in the performance of such investments to a greater extent than that of a more diversified account. Returns realized by a client account may be adversely affected if a small number of these investments perform poorly.
Index performance is discussed for illustrative purposes only as a benchmark for each strategy’s performance, and does not predict or depict performance of that strategy. While index comparisons may be useful to provide a benchmark for a strategy’s performance, it must be noted that investments are not limited to the investments comprising the indices. Each of the strategy benchmark indices are unmanaged and cannot be purchased directly by investors. It is not possible to invest in an index.
This message is provided for informational purposes only, reflects our general views on investing and should not be relied upon as recommendations or financial planning advice. We encourage you to seek personalized advice from qualified professionals, including (without limitation) tax professionals, regarding all personal finance issues. While we can counsel on tax efficiency and general tax considerations, MFWM does not (and is not permitted to) provide tax or legal advice. Clients who need such advice should consult tax and legal professionals. This message may not be relied upon as personalized financial planning or tax advice.
MFWM is an SEC registered investment advisor with a fiduciary duty that requires it to act in the best interests of clients and to place the interests of clients before its own. HOWEVER, REGISTRATION AS AN INVESTMENT ADVISOR DOES NOT IMPLY ANY LEVEL OF SKILL OR TRAINING. Access to MFWM is only available to clients pursuant to an Investment Advisory Agreement and acceptance of our Client Relationship Summary and Brochure (Form ADV, Parts 2A and 2B). You are encouraged to read these documents carefully. All investments involve risk and may lose money. MFWM does not guarantee the results of any of its advice or account management. Clients should be aware that their individual account results may not exactly match the performance of any of our Model Portfolios. Past performance is no guarantee of future results. Each Personal Portfolio is subject to an account minimum, which varies based on the strategies included in the portfolio. MFWM retains the right to revise or modify portfolios and strategies if it believes such modifications would be in the best interests of its clients.
During discussions with our Wealth Advisors, they may provide advice with respect to 401(k) and IRA rollovers into accounts that are managed by MFWM. Such recommendations pose potential conflicts of interest in that rolling retirement savings into a MFWM managed account will generate ongoing asset-based fees for MFWM that it would not otherwise receive.
Fixed Income
Portfolio Managers
Tony Arsta, CFANate Weisshaar, CFA
While equity investors focused on conflict in Iran and the closing of the Strait of Hormuz, credit investors had their own source of concern: private credit.
With increased regulations after the Great Financial Crisis (GFC), banks have broadly reduced their lending to small- and medium-sized companies. Their newly constrained balance sheets just couldn’t justify the resources and risk that came with these smaller loans.
Nature abhors a vacuum almost as much as capital markets do, so private equity (a few of the bigger names include Blackstone, KKR, and Apollo) stepped into the void. According to the Federal Reserve, private debt has grown 5x since 2009 and today sits at $2 trillion worldwide. 1
That’s a big number, but let’s put it in context. Loans written by US banks totaled $13.5 trillion at year-end, 2 and the investment-grade corporate debt market was $11.5 trillion. 3 The problem with private debt is that it is essentially a black box. Unlike banks, which have extensive quarterly reporting standards and investment-grade debt evaluated by third parties like Moody’s and S&P, there is almost no disclosure from private equity firms about the loans they are writing.
When things are good, this isn’t a huge deal, but we’ve had several admittedly likely one-off bankruptcies and defaults in the past year, and now we have the fear that AI will destroy the economic models of software companies. That last bit is particularly important because, as Morgan Stanley estimates, loans to software companies are the single largest sector concentration in collateralized lending (CLOs, a subsector of private debt), making up 12% of these types of loans. 4
Again, this is a relatively small piece of the economy, and there isn’t any clear evidence that these loans are going bad at any scale, but these developments have introduced uncertainty into stock and bond markets that were, by most accounts, pretty optimistically priced.
As your Fixed Income SMA is almost completely invested in investment-grade corporate debt, these concerns are even further reduced, but it is always good to understand the water in which you’re swimming.
During the quarter, the Federal Reserve held rates steady twice. 5 They are walking a bit of a tightrope between employment numbers, which generally seem less robust, and sticky inflation (which won’t be helped by oil prices jumping over $100/barrel with events in Iran). Prediction market Kalshi suggests there could be no rate cuts this year, 6 compared to expectations at the beginning of the year for two cuts.
Over the past three months, we’ve also seen short-term interest rates rise as inflation fears and concerns about the government’s fiscal discipline swim in investors’ minds.
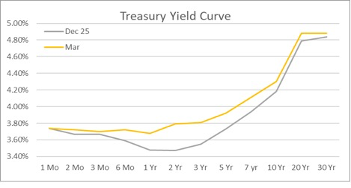
For income investors, this is a welcome development: we could get a better yield without moving too far out on the maturity scale. For a heavily indebted government that has $10 trillion in debt7 maturing over the next 12 months and already pays almost $0.20 of every tax dollar on debt service.8 Higher rates will just make that obligation more onerous.
The rise in rates during the quarter means fixed income instruments broadly struggled (the rates old debt pays are less attractive when current rates are higher), and your Fixed Income SMA was no exception.
| QTD | YTD | 1Y | 3Y | 5Y | 10Y | |
|---|---|---|---|---|---|---|
| Fixed Income | -0.63 | -0.63 | 4.12 | 4.30 | 1.31 | 1.46 |
| Bloomberg Barclays US Corporate Bond Index | -0.22 | -0.22 | 5.31 | 5.49 | 1.99 | 3.15 |
But as I try to remind our clients every quarter, ~75% of your portfolio is invested in an investment-grade corporate debt ladder, which is structured like a hold-to-maturity portfolio. This means we’re far less concerned with intra-period price moves. As long as the companies that issued our debt remain solvent, we’ll receive our interest payments and principal at maturity. The rest is just noise.
During the quarter, we exited our small position in the State Street/Blackstone Senior Loan ETF. For those paying attention, you might ask, “Why, if you are so sanguine about private debt as stated above, would you exit our high-yield exposure to private debt?”
Fair enough. While we don’t see evidence of a significant credit issue in the private debt space, we’ve been known to be wrong from time to time. Given our mandate to minimize risk for our part of your portfolio, the risk/return profile wasn’t right. If we’re wrong and a large swath of private loans go bad, you could theoretically see the 5% position evaporate. If we’re right to be sanguine, you miss out on roughly 0.1% yield on your portfolio. 9
We took the proceeds from the sale of the Senior Loan ETF, accumulated dividends, and built out our positions in the 2033 and 2034 rungs of the ladder. We also added to our position in the iShares J.P. Morgan EM Local Currency Bond ETF and the DoubleLine Commercial Real Estate Debt ETF.
Although the geopolitical events of the past couple months (Venezuela, Iran, and more China) have driven the dollar up (it is broadly viewed as a safe harbor in times of uncertainty), your portfolio managers still believe the US’s fiscal situation will translate into a weaker dollar in years to come, so we’re building exposure to government debt that pays out in currencies that aren’t US dollars.
We added to the DoubleLine CRE ETF because we believe that disciplined selection of commercial real estate debt offers opportunities not only because diverging from the index should provide pricing advantages, but also because good commercial real estate has been recovering from the COVID/work-from-home pain. With managers we trust to unearth these opportunities, we also like the different risk profile of commercial real estate vs corporate debt, which dominates your portfolio.
Sources & References
1. Private Credit Market Growth
2. U.S. Bank Lending Volume
3. U.S. Investment Grade Corporate Bond Market
4. Private Credit Exposure to Software Companies
Reuters - Debt Investors Offloading Exposure to Software Companies
5. Federal Reserve Meeting Dates
6. Rate Cut Probability (Betting Markets)
7. U.S. Treasury Maturity Wall
Apollo Daily Spark - $14 Trillion in Supply Coming to the Market
8. U.S. Government Debt Service Payments
9. Fixed Income SMA Yield Comparison
SRLN has a 6.9% yield right now vs ~4.8% for the portfolio. 210bp × 5% position = ~10bp
The above information is intended solely for current clients of Motley Fool Wealth Management (“MFWM”) for the purpose of providing insight into how we manage our strategies and our investment philosophy. This information should not be disclosed to third parties or duplicated or used for any purpose other than the purpose for which it has been provided.
All information presented herein is for informational purposes only and should not be deemed as investment advice or a recommendation to purchase or sell any specific security. This information reflects the opinions, estimates and projections of MFWM as of the date of publication, which are subject to change without notice. We do not represent that any opinion, estimate or projection will be realized. While we believe this information to be reliable, no representation or warranty is made concerning its accuracy.
Performance results are based on a representative account for each strategy, not individual client accounts. Clients can see their actual account performance on the Interactive Brokers’ website at any time. Client account results may not exactly match the performance of the representative accounts. Such variance is due to a number of factors, including differences in trade prices, transaction fees, market activity, any restrictions have you may have imposed on your account(s), and the amount and the timing of deposits or withdrawals.
The performance information presented herein has been generated during a period of extraordinary market volatility. Accordingly, the performance is not necessarily indicative of results that we may achieve in the future, and we do not represent and it cannot be assumed that the performance of our strategies will be subject to the same economic risk factors that contributed to the above returns. Performance results discussed above represent past performance, which does not guarantee future results. The investment return and principal value of an investment will fluctuate so that current performance may be lower or higher than the performance discussed above. The investment strategy and focus of our model portfolio strategies can change over time. Similarly, there is no assurance that the securities purchased will remain in a model portfolio strategy or that securities sold may not be repurchased. The mention of specific holdings does not constitute a recommendation by MFWM or its affiliates.
To the extent we invest more heavily in particular sectors or industries of the economy, the performance of our strategies will be especially sensitive to developments that significantly affect those sectors or industries. While investing in a particular sector is not a principal investment strategy of any model portfolio, client portfolios may be significantly invested in a sector or industry as a result of our portfolio management decisions. Similarly, a model portfolio’s investment may become concentrated in a small number of issuers. To the extent that we take large positions in a small number of investments, account returns may fluctuate as a result of changes in the performance of such investments to a greater extent than that of a more diversified account. Returns realized by a client account may be adversely affected if a small number of these investments perform poorly.
Index performance is discussed for illustrative purposes only as a benchmark for each strategy’s performance, and does not predict or depict performance of that strategy. While index comparisons may be useful to provide a benchmark for a strategy’s performance, it must be noted that investments are not limited to the investments comprising the indices. Each of the strategy benchmark indices are unmanaged and cannot be purchased directly by investors. It is not possible to invest in an index.
This message is provided for informational purposes only, reflects our general views on investing and should not be relied upon as recommendations or financial planning advice. We encourage you to seek personalized advice from qualified professionals, including (without limitation) tax professionals, regarding all personal finance issues. While we can counsel on tax efficiency and general tax considerations, MFWM does not (and is not permitted to) provide tax or legal advice. Clients who need such advice should consult tax and legal professionals. This message may not be relied upon as personalized financial planning or tax advice.
MFWM is an SEC registered investment advisor with a fiduciary duty that requires it to act in the best interests of clients and to place the interests of clients before its own. HOWEVER, REGISTRATION AS AN INVESTMENT ADVISOR DOES NOT IMPLY ANY LEVEL OF SKILL OR TRAINING. Access to MFWM is only available to clients pursuant to an Investment Advisory Agreement and acceptance of our Client Relationship Summary and Brochure (Form ADV, Parts 2A and 2B). You are encouraged to read these documents carefully. All investments involve risk and may lose money. MFWM does not guarantee the results of any of its advice or account management. Clients should be aware that their individual account results may not exactly match the performance of any of our Model Portfolios. Past performance is no guarantee of future results. Each Personal Portfolio is subject to an account minimum, which varies based on the strategies included in the portfolio. MFWM retains the right to revise or modify portfolios and strategies if it believes such modifications would be in the best interests of its clients.
During discussions with our Wealth Advisors, they may provide advice with respect to 401(k) and IRA rollovers into accounts that are managed by MFWM. Such recommendations pose potential conflicts of interest in that rolling retirement savings into a MFWM managed account will generate ongoing asset-based fees for MFWM that it would not otherwise receive.
International
Portfolio Managers
Tony Arsta, CFAMichael Olsen, CFA
We won’t rehash what you already know: The past quarter was eventful. War in Iran, the possibility of a prolonged energy shock impacting energy-dependent European and Asian economies, lingering AI anxieties, and the possibility of stickier inflation amid mixed growth outlooks weighed on international markets. Against this backdrop, international indices flagged. The International SMA underperformed, declining 6.92% net of fees versus -0.68% for its benchmark.
Relative underperformance was driven by a few factors: sector/geography weightings relative to the benchmark, AI anxieties, and declines in ICON shares (one of our larger holdings). On point one: Your International SMA consciously underweights materials, energy, and financials—because these businesses generally lack the ability to control their destiny, and are not of particularly high quality. While this might contribute to transitory/temporary underperformance, we believe it represents an intelligent long-term decision. On the second: A lot of our businesses have been hit by AI fears. Without parsing individual arguments, we’ve been careful to own businesses that possess what we believe to be durable competitive advantages. We believe these businesses will thrive, even in a world where AI’s impact is magnified. Last, ICON shares declined precipitously on news that the company was investigating its accounting practices—we believe the market has overreacted, as we’ll discuss below.
| QTD | YTD | 1Y | 3Y | 5Y | 10Y | |
|---|---|---|---|---|---|---|
| International | -6.92 | -6.92 | -1.70 | 4.00 | 0.46 | 6.24 |
| S&P Global ex-U.S. | -0.68 | -0.68 | 25.66 | 14.89 | 7.16 | 8.83 |
We’d also note that we’re long-term investors in businesses. In a very practical sense, this can mean protracted periods of underperformance. It also means taking a long view of prospective outcomes during uncertainty—slowing down where the market, as a collective, jumps to a conclusion—as these can often plant the seeds of future outperformance. We’re slowing down. We’re taking the long view.
Portfolio Contributors
A review of key contributors to the portfolio’s quarterly results follows. As we’ve written before, a portion of your International SMA remains invested in ETFs to achieve geographic exposures: 14.69% on average, returning 3.23% on a weighted average basis. On a weighted basis, giving effect to average weighting and absolute return, the portfolio’s largest contributor and largest detractor were as follows:
- Banco Latinoamericano de Comercio Exterior: 16.10% return; 4.58% average weighting
- ICON plc: -39.27% return; 3.76% average weighting
Latin American trade bank Bladex, formally known as Banco Latinoamericano de Comercio Exterior, rallied in the quarter past—on strong fourth quarter results, a buoyant outlook for value stock and materials, and fundamentally improving results. To wit: Bladex management delivered on a longstanding promise, a mid-teens return on equity (ROE), and posted strong growth in loans and deposits. While Bladex shares aren’t quite so cheap as they’ve been, we remain happy owners.
Shares of contract research organization ICON fell sharply on news that the company was investigating previous financials, expected to restate 2023 and 2024 financials, and would not report fourth quarter results or issue 2026 guidance until the investigation was complete. This sounds existential on its face, and the markets inferred the worst. But on closer examination, we believe it’s less dire. To the contrary, we believe ICON shares represent compelling value at current prices. Why, you might ask?
In our view, the matter in question is ICON’s recognition of revenue. More specifically, revenues “may have been overstated by less than two percent” in 2023 and 2024. To start, this is a small number, hardly one that warrants a 40% share price decline. More saliently, we’d point out the investigation has more to do with accounting arcana—revenue recognition can be distinct from cold, hard cash. The subject of the investigations is distinct from ICON’s actual cash flow—which remains unchanged, and is the ultimate arbiter of value—for the years in question. So, why did the shares fall so much? We can only infer that, after a tough stretch, the market assumed cockroaches.
To take a brutally reductionist frame to the matter in question: we believe ICON remains a real, competitively advantaged business, but its valuation effectively presumes a business in decline, as shares trade at 8 times trailing free cash flow. That cash flow is real, and we don’t think ICON’s business faces existential risk or ongoing declines. While some rough patches may still lie ahead, we’re willing to take the other side of that bet as long-term investors.
Portfolio Activity
It was an active quarter for us. We established a new position, RELX; added to our positions in London Stock Exchange Group and Symrise; trimmed our positions in Brookfield Asset Management and Taiwan Semiconductor; and sold out of our positions in Budweiser and Porsche. Details around each decision follow.
We established a new position in RELX. RELX is a global provider of information-based analytics and decision tools serving professionals across four segments: Risk; Scientific, Technical & Medical (STM); Legal; and Exhibitions. It is perhaps best known for its LexisNexis and Elsevier brands. Roughly 85% of revenue is delivered electronically, with ~55% subscription-based and the bulk of the remaining transactional revenue under long-term volume-based contracts, giving the business a highly recurring revenue profile.
At the time of our purchase, RELX shares had declined about 45% from their 2025 peak, driven by a broad selloff in information services stocks tied to AI disruption fears, which accelerated with the launch of Anthropic's Claude legal plug-in. The stock was trading at rarely seen multiples for a company that had consistently delivered in the past. While understandable, we believe the market was dramatically overweighting the AI threat to RELX's Legal segment; the LexisNexis legal data assets remain extraordinarily difficult to replicate. Additionally, this legal segment contributes roughly 10-13% of the company’s total profit – the recent price declines appear to be assuming a catastrophic scenario. We believe this presents us with an attractive risk/reward imbalance.
We added to our position in London Stock Exchange Group. Shares were caught in the same AI-driven selloff that hit the broader information services sector. The market seemed to assume the risk of AI disruption extends to companies that actually own the data, the root of LSEG’s advantage, in our view. Its proprietary datasets are not easily replicated. In the current paradigm, LSEG would become a supplier to these new AI-based distribution channels rather than a victim of them. The company has already announced integrations with Anthropic, OpenAI, and Databricks, requiring LSEG subscriptions for access. While some encroachment is a fair concern, not all aspects of LSEG’s business should be at risk. We believe that the risk/reward profile was, and remains, out of balance here.
We added to our position in flavors and fragrance purveyor Symrise in the quarter past. At the time of our purchase, Symrise traded at a historically low multiple—for a business of this quality. The company has experienced recent sales growth weakness, in units believed to be structural growth entities, but none of these issues strike us as existential to the core franchise's long-term prospects. Symrise operates in an oligopolistic industry where its products represent a tiny fraction of customer costs but are critical to the end consumer's purchasing decision. We think the market is overly punishing near-term noise in a durable compounder.
We trimmed our position in Taiwan Semiconductor Manufacturing, as shares traded near all-time highs after a tremendous run. At the time of our trim, the stock had roughly doubled over the past year on the back of insatiable AI chip demand. The business continued to deliver results that can justify the stock price gains. We trimmed a small amount from what had become an outsized position, not because anything had changed in the thesis, but to manage position sizing and redeploy capital into other high-conviction opportunities that arose.
We trimmed our position in Brookfield Asset Management. The business continued to execute well, and we remain long-term believers in the alternative asset management growth story. This was a modest trim from an overweight position to fund high-conviction opportunities elsewhere in the portfolio.
We sold our position in Porsche—a deeply frustrating hold. At the time of our sale, the stock had fallen roughly 50% from its IPO price, and the underlying business deteriorated far more than we anticipated. Operating margins have collapsed, driven by a costly strategic reversal on electrification, plunging China volumes, and U.S. tariff headwinds. Management continues to frame 2025 as the "trough year" with a recovery coming in 2026, but the company has serially over-promised and under-delivered. The EV pivot required billions in investment, only for the company to reverse course. We no longer have confidence in management's ability to execute, and with a new CEO taking the helm in January 2026, the path forward remains uncertain.
We sold our position in AB InBev, the dominant global brewer with an unmatched brand portfolio. While the company has executed well, the stock has rallied smartly, up over 50% from its lows. With the thesis largely playing out and the valuation no longer compelling, we took profits and redeployed into higher-conviction opportunities where we see a more attractive risk/reward setup.
The above information is intended solely for current clients of Motley Fool Wealth Management (“MFWM”) for the purpose of providing insight into how we manage our strategies and our investment philosophy. This information should not be disclosed to third parties or duplicated or used for any purpose other than the purpose for which it has been provided.
All information presented herein is for informational purposes only and should not be deemed as investment advice or a recommendation to purchase or sell any specific security. This information reflects the opinions, estimates and projections of MFWM as of the date of publication, which are subject to change without notice. We do not represent that any opinion, estimate or projection will be realized. While we believe this information to be reliable, no representation or warranty is made concerning its accuracy.
Performance results are based on a representative account for each strategy, not individual client accounts. Clients can see their actual account performance on the Interactive Brokers’ website at any time. Client account results may not exactly match the performance of the representative accounts. Such variance is due to a number of factors, including differences in trade prices, transaction fees, market activity, any restrictions have you may have imposed on your account(s), and the amount and the timing of deposits or withdrawals.
The performance information presented herein has been generated during a period of extraordinary market volatility. Accordingly, the performance is not necessarily indicative of results that we may achieve in the future, and we do not represent and it cannot be assumed that the performance of our strategies will be subject to the same economic risk factors that contributed to the above returns. Performance results discussed above represent past performance, which does not guarantee future results. The investment return and principal value of an investment will fluctuate so that current performance may be lower or higher than the performance discussed above. The investment strategy and focus of our model portfolio strategies can change over time. Similarly, there is no assurance that the securities purchased will remain in a model portfolio strategy or that securities sold may not be repurchased. The mention of specific holdings does not constitute a recommendation by MFWM or its affiliates.
To the extent we invest more heavily in particular sectors or industries of the economy, the performance of our strategies will be especially sensitive to developments that significantly affect those sectors or industries. While investing in a particular sector is not a principal investment strategy of any model portfolio, client portfolios may be significantly invested in a sector or industry as a result of our portfolio management decisions. Similarly, a model portfolio’s investment may become concentrated in a small number of issuers. To the extent that we take large positions in a small number of investments, account returns may fluctuate as a result of changes in the performance of such investments to a greater extent than that of a more diversified account. Returns realized by a client account may be adversely affected if a small number of these investments perform poorly.
Index performance is discussed for illustrative purposes only as a benchmark for each strategy’s performance, and does not predict or depict performance of that strategy. While index comparisons may be useful to provide a benchmark for a strategy’s performance, it must be noted that investments are not limited to the investments comprising the indices. Each of the strategy benchmark indices are unmanaged and cannot be purchased directly by investors. It is not possible to invest in an index.
This message is provided for informational purposes only, reflects our general views on investing and should not be relied upon as recommendations or financial planning advice. We encourage you to seek personalized advice from qualified professionals, including (without limitation) tax professionals, regarding all personal finance issues. While we can counsel on tax efficiency and general tax considerations, MFWM does not (and is not permitted to) provide tax or legal advice. Clients who need such advice should consult tax and legal professionals. This message may not be relied upon as personalized financial planning or tax advice.
MFWM is an SEC registered investment advisor with a fiduciary duty that requires it to act in the best interests of clients and to place the interests of clients before its own. HOWEVER, REGISTRATION AS AN INVESTMENT ADVISOR DOES NOT IMPLY ANY LEVEL OF SKILL OR TRAINING. Access to MFWM is only available to clients pursuant to an Investment Advisory Agreement and acceptance of our Client Relationship Summary and Brochure (Form ADV, Parts 2A and 2B). You are encouraged to read these documents carefully. All investments involve risk and may lose money. MFWM does not guarantee the results of any of its advice or account management. Clients should be aware that their individual account results may not exactly match the performance of any of our Model Portfolios. Past performance is no guarantee of future results. Each Personal Portfolio is subject to an account minimum, which varies based on the strategies included in the portfolio. MFWM retains the right to revise or modify portfolios and strategies if it believes such modifications would be in the best interests of its clients.
During discussions with our Wealth Advisors, they may provide advice with respect to 401(k) and IRA rollovers into accounts that are managed by MFWM. Such recommendations pose potential conflicts of interest in that rolling retirement savings into a MFWM managed account will generate ongoing asset-based fees for MFWM that it would not otherwise receive.
Large Cap Core
Portfolio Managers
Tony Arsta, CFAJeremy Myers, CFA
If the first quarter was any indication of what 2026 will hold, we could be in for a doozy. Worries about AI disruption started in the software sector and quickly spread to commercial real estate, insurance brokers, travel agents, freight brokers, and financial data services, just to name a few. Many of these companies were long considered the crème de la crème of highest quality businesses with the most durable economic moats. It was almost as if you were watching the markets reassess their core beliefs in real time as the panic jumped from one group to the next based solely on whatever new agentic tools Anthropic or OpenAI released that week. Add in the conflict with Iran, the possibility of a return to higher inflation, and rising interest rates, and it has become increasingly difficult to predict where the market will head next.
During the first quarter, the Large Cap Core strategy posted a -7.44% return, net of fees, versus an -4.33% return for its benchmark, the S&P 500®. Our underperformance can largely be attributed to two factors: large exposure to the technology and communication services sectors, which both underperformed, and no exposure to the energy and materials sectors, which were the top two performers.
This shift in sentiment is encapsulated in a new investment theme that developed this quarter called the “HALO” trade. In case you missed it, HALO is an acronym for “Heavy Asset, Low Obsolescence,” which is the idea that companies that require a large pool of physical assets to operate are less likely to be disrupted by AI technology, and could even benefit from its adoption through automation. Though we think there could be some legitimacy to this thesis, the energy and materials sectors have mostly benefited from a short-term spike in inflation expectations and are currently trading in lockstep with commodity prices. If inflation actually materializes, some of those other HALO gainers, like industrials, could be hit by increased costs and slowing global economic growth.
It seems like an odd time to quote Vladimir Lenin, but he famously said, “There are decades where nothing happens; and there are weeks where decades happen.” It feels like we’ve experienced more than the normal share of those “weeks” in the past few months. In these volatile times, we try to maintain focus on our disciplined approach of investing only in high-quality businesses with exceptional management teams and durable competitive advantages. Though this approach has been out of favor over the past year, we remain confident that companies with predictable revenue, high profitability, and strong cash flow should perform well over the full economic cycle and investors could ultimately be rewarded for their patience.
| QTD | YTD | 1Y | 3Y | 5Y | 10Y | |
|---|---|---|---|---|---|---|
| US Large Cap Core | -7.44 | -7.44 | 2.70 | 13.61 | 6.64 | 13.39 |
| Benchmark (S&P 500) | -4.33 | -4.33 | 17.80 | 18.32 | 12.07 | 14.17 |
Factoring in position size and performance, the portfolio’s largest contributor and detractor were as follows:
- Equinix: 28.63% return; 4.34% weighting
- Booking Holdings: -21.20% return; 4.13% weighting
Equinix’s strong quarter, which we believe was largely attributed to better-than-expected forward guidance as the company is seeing improving demand for its data center services. The stock sputtered in 2025 after management announced increased capex spending to fuel the rapid growth in compute demand from AI companies. That forecasted demand is beginning to show up in Equinix’s bookings, which are expected to accelerate through the end of the year. Longer-term, we think Equinix is well-positioned as AI companies shift from training models to more distributed inference applications that require proximity to end users to minimize latency.
Booking Holdings posted a strong quarter, but the stock was still hit on multiple fronts. Early in the quarter, investors became concerned that online travel agents were at risk of being displaced by AI agents that could automate travel booking for consumers. There was a brief sigh of relief when OpenAI announced it no longer intended to process transactions on its platform, but the intensifying conflict in Iran has dragged the stock down further. On top of tens of thousands of flights being cancelled, investors are worried that rising oil prices will cause consumers to cut back on travel and stay closer to home. This concern could be a headwind as long as the Straight of Hormuz is closed to tanker traffic, and management has announced that they are focused on cutting at least $500 million in costs in the coming year. We think Booking should continue to perform well over the long term, but the next few quarters could be bumpy.
Transactions
During the quarter, we trimmed our Alphabet position and used those proceeds and cash on hand to add to existing positions in Netflix and ServiceNow. Alphabet has been one of our best performers over the past year and had grown into our largest position by a wide margin. For risk management purposes, we're taking some profits from a winner to fund a handful of opportunities where we see more attractive risk/reward profiles.
ServiceNow is facing negative investor sentiment despite the business executing exceptionally well. The thesis from our initial purchase, that ServiceNow is uniquely positioned to monetize agentic AI through its workflow automation platform, has only gotten stronger. The company has since announced partnerships with both OpenAI and Anthropic and seen its AI-related pipeline materially expand. Also, CEO Bill McDermott has been buying shares personally, and other executives have canceled their automatic selling plans.
Our purchase of Netflix earlier this quarter turned out to be well-timed. Shares had fallen steeply as the company found itself in a bidding contest with Paramount for a portion of the Warner Bros. Discovery media assets. Our thesis was that Netflix was well-positioned regardless of outcome: if the deal closes, they acquire HBO and a century of iconic IP at a moment of weakness; if it falls through, you're left with a high-margin, low-leverage compounder at a historically cheap multiple. Everything else we like about the company—pricing power, global scale, the advertising ramp, live events—remains intact. Since Netflix management decided to bow out of the race, shares have rallied nearly 30%, and you end up with streaming competitor Paramount taking on a ton of debt and likely overpaying to win the deal.
The above information is intended solely for current clients of Motley Fool Wealth Management (“MFWM”) for the purpose of providing insight into how we manage our strategies and our investment philosophy. This information should not be disclosed to third parties or duplicated or used for any purpose other than the purpose for which it has been provided.
All information presented herein is for informational purposes only and should not be deemed as investment advice or a recommendation to purchase or sell any specific security. This information reflects the opinions, estimates and projections of MFWM as of the date of publication, which are subject to change without notice. We do not represent that any opinion, estimate or projection will be realized. While we believe this information to be reliable, no representation or warranty is made concerning its accuracy.
Performance results are based on a representative account for each strategy, not individual client accounts. Clients can see their actual account performance on the Interactive Brokers’ website at any time. Client account results may not exactly match the performance of the representative accounts. Such variance is due to a number of factors, including differences in trade prices, transaction fees, market activity, any restrictions have you may have imposed on your account(s), and the amount and the timing of deposits or withdrawals.
The performance information presented herein has been generated during a period of extraordinary market volatility. Accordingly, the performance is not necessarily indicative of results that we may achieve in the future, and we do not represent and it cannot be assumed that the performance of our strategies will be subject to the same economic risk factors that contributed to the above returns. Performance results discussed above represent past performance, which does not guarantee future results. The investment return and principal value of an investment will fluctuate so that current performance may be lower or higher than the performance discussed above. The investment strategy and focus of our model portfolio strategies can change over time. Similarly, there is no assurance that the securities purchased will remain in a model portfolio strategy or that securities sold may not be repurchased. The mention of specific holdings does not constitute a recommendation by MFWM or its affiliates.
To the extent we invest more heavily in particular sectors or industries of the economy, the performance of our strategies will be especially sensitive to developments that significantly affect those sectors or industries. While investing in a particular sector is not a principal investment strategy of any model portfolio, client portfolios may be significantly invested in a sector or industry as a result of our portfolio management decisions. Similarly, a model portfolio’s investment may become concentrated in a small number of issuers. To the extent that we take large positions in a small number of investments, account returns may fluctuate as a result of changes in the performance of such investments to a greater extent than that of a more diversified account. Returns realized by a client account may be adversely affected if a small number of these investments perform poorly.
Index performance is discussed for illustrative purposes only as a benchmark for each strategy’s performance, and does not predict or depict performance of that strategy. While index comparisons may be useful to provide a benchmark for a strategy’s performance, it must be noted that investments are not limited to the investments comprising the indices. Each of the strategy benchmark indices are unmanaged and cannot be purchased directly by investors. It is not possible to invest in an index.
This message is provided for informational purposes only, reflects our general views on investing and should not be relied upon as recommendations or financial planning advice. We encourage you to seek personalized advice from qualified professionals, including (without limitation) tax professionals, regarding all personal finance issues. While we can counsel on tax efficiency and general tax considerations, MFWM does not (and is not permitted to) provide tax or legal advice. Clients who need such advice should consult tax and legal professionals. This message may not be relied upon as personalized financial planning or tax advice.
MFWM is an SEC registered investment advisor with a fiduciary duty that requires it to act in the best interests of clients and to place the interests of clients before its own. HOWEVER, REGISTRATION AS AN INVESTMENT ADVISOR DOES NOT IMPLY ANY LEVEL OF SKILL OR TRAINING. Access to MFWM is only available to clients pursuant to an Investment Advisory Agreement and acceptance of our Client Relationship Summary and Brochure (Form ADV, Parts 2A and 2B). You are encouraged to read these documents carefully. All investments involve risk and may lose money. MFWM does not guarantee the results of any of its advice or account management. Clients should be aware that their individual account results may not exactly match the performance of any of our Model Portfolios. Past performance is no guarantee of future results. Each Personal Portfolio is subject to an account minimum, which varies based on the strategies included in the portfolio. MFWM retains the right to revise or modify portfolios and strategies if it believes such modifications would be in the best interests of its clients.
During discussions with our Wealth Advisors, they may provide advice with respect to 401(k) and IRA rollovers into accounts that are managed by MFWM. Such recommendations pose potential conflicts of interest in that rolling retirement savings into a MFWM managed account will generate ongoing asset-based fees for MFWM that it would not otherwise receive.
Hedged Equity
Portfolio Managers
JP Bennett, CFAMichael Olsen, CFA
It would suffice to say that the quarter past was, well, less than ordinary. Markets were buffeted by semi-continuous and evolving AI-related anxieties, concerns over the possibility and magnitude of interest rate cuts (or, daresay, increases), war in Iran and the associated geopolitical angst, and an almost generational energy price spike (and concerns over the possibility of durably higher energy costs). Against this backdrop, investors were, somewhat understandably, unnerved. In a decided contrast to recent trends, big tech and growthier fare suffered amid AI overinvestment fears and elevated valuations, while energy, materials, and more cyclical fare—"value” stocks—outperformed.
Against this backdrop, the Hedged Equity SMA performed poorly—declining -11.74%, versus -3.03% for its benchmark, 70% of the S&P 500. A trio of factors underlie this: underperformance of large tech holdings, angst surrounding the impact of AI on several of the SMA’s larger positions, and company/market-specific concerns at Alphatec Holdings and ICON. In each of the aforementioned circumstances, we advocate a long view.
On the first point: we believe our large tech holdings remain fundamentally undervalued, and represent essential pieces of infrastructure in the burgeoning AI ecosystem. On the matter of angst surrounding AI and its impact on our holdings: We acknowledge that the long-term impact of AI remains unclear, as the technology and its evolution remain fluid. But we believe the businesses in your Hedged Equity SMA are unique and hard-to-replicate franchises underpinned by durable competitive advantages—and that each should benefit from AI in the long-term. On the matter of Alphatec and ICON, we believe the market has fundamentally misunderstood their prospects and recent news events, and that they represent compelling value at current prices.
Taking a 30,000-foot view of recent events, some context is in order. We remain long-term, business-focused investors. Markets can be—are—odd animals, in the short-term and often longer. We can’t control how the markets perceive our businesses, and their prospects—however peripatetic. But we can control how we react. We remain confident in our holdings and their prospects.
| QTD | YTD | 1Y | 3Y | 5Y | 10Y | |
|---|---|---|---|---|---|---|
| Hedged Equity | -11.96 | -11.96 | -11.45 | 4.26 | -1.11 | 6.38 |
| Benchmark (70% of the S&P 500) | -3.03 | -3.03 | 12.29 | 12.69 | 8.58 | 9.99 |
Portfolio Contributors
On reviewing the past quarter’s performance, the largest contributor and detractor, adjusting for weighting and performance, were as follows:
- NextEra Energy: 16.46% return; 5.29% average weighting
- Alphatec: -48.24% return; 4.82% average weighting
Shares of utility operator NextEra Energy rallied smartly in the quarter past on a combination of strong underlying demand expectations from AI and data centers, a recently inked partnership with Google, and solid earnings. Most significantly, we believe NextEra occupies the nexus of several favorable crosswinds: investor demand for value/dividend stocks of late, inexorable demand for power (which renewables are well-positioned to fulfill at relatively short notice), and ongoing AI inertia.
Alphatec Holdings shares fell 48% during the quarter, despite strong Q4 results in early March. 2025 revenues grew 25% to $764 million, and management is guiding for high-teens growth in 2026 to revenue of $890 million. That growth comes from expanding the user base of spine surgeons who utilize Alphatec’s products, as well as driving higher volumes with their existing surgeon base. The company currently has 8% market share in spine surgeries in the U.S. and has been capturing approximately 1% share per year over the past five years. The performance of the shares in Q1 is disconnected from the businesses’ fundamental performance, and in our opinion, the thesis remains intact.
Portfolio Activity
It was an active quarter for us. We started several new positions: RELX, London Stock Exchange Group, ServiceNow, and Netflix. We sold out of our positions in Budweiser and Porsche. Details around each decision follow.
We established a new position in RELX. RELX is a global provider of information-based analytics and decision tools serving professionals across four segments: Risk; Scientific, Technical & Medical (STM); Legal; and Exhibitions. It is perhaps best known for its LexisNexis and Elsevier brands. Roughly 85% of revenue is delivered electronically, with ~55% subscription-based and the bulk of the remaining transactional revenue under long-term volume-based contracts, giving the business a highly recurring revenue profile.
At the time of our purchase, RELX shares had declined about 45% from their 2025 peak, driven by a broad selloff in information services stocks tied to AI disruption fears, which accelerated with the launch of Anthropic's Claude legal plug-in. The stock was trading at rarely seen multiples for a company that has consistently delivered in the past. While understandable, we believe the market was dramatically overweighting the AI threat to RELX's Legal segment; the LexisNexis legal data assets remain extraordinarily difficult to replicate. Additionally, this legal segment contributes roughly 10-13% of the company’s total profit – the recent price declines appear to be assuming a catastrophic scenario. We believe this presents us with an attractive risk/reward imbalance.
We also started a position in London Stock Exchange Group. Shares were caught in the same AI-driven selloff that hit the broader information services sector. The market seemed to assume the risk of AI disruption extends to companies that actually own the data, the root of LSEG’s advantage, in our view. Its proprietary datasets are not easily replicated. In the current paradigm, LSEG would become a supplier to these new AI-based distribution channels rather than a victim of them. The company has already announced integrations with Anthropic, OpenAI, and Databricks, requiring LSEG subscriptions for access. While some encroachment is a fair concern, not all aspects of LSEG’s business should be at risk. We believe that the risk/reward profile was, and remains, out of balance here.
Amid the sell-off in almost all things software, ServiceNow was pulled down, despite the business executing exceptionally well. We believe ServiceNow is uniquely positioned to monetize agentic AI through its workflow automation platform. This thesis has only gotten stronger as the company has announced partnerships with both OpenAI and Anthropic and seen its AI-related pipeline materially expand. CEO Bill McDermott is buying shares personally, and other executives have canceled their automatic selling plans.
Last, we started a position in Netflix. At the time of our purchase, Netflix shares had fallen heavily from their June 2025 all-time high, representing a rare valuation for this business. The decline began as a valuation reset in the second half of 2025, but accelerated sharply after the December announcement of the proposed acquisition of Warner Bros. Discovery. At the time, we believed the shares priced in a worst-case scenario, but the underlying business remained excellent. Importantly, we believed Netflix is well-positioned regardless of outcome: if the deal closes, they acquire HBO and a century of iconic IP at a moment of weakness; if it falls through, we’re left with a high-margin, low-leverage compounder at a historically cheap multiple. Everything else we like about the company—pricing power, global scale, the advertising ramp, live events—remained intact.
We sold our position in Porsche—a deeply frustrating hold. At the time of our sale, the stock had fallen roughly 50% from its IPO price, and the underlying business deteriorated far more than we anticipated. Operating margins have collapsed, driven by a costly strategic reversal on electrification, plunging China volumes, and U.S. tariff headwinds. Management continues to frame 2025 as the "trough year" with a recovery coming in 2026, but the company has serially over-promised and under-delivered. The EV pivot required billions in investment, only for the company to reverse course. We no longer have confidence in management's ability to execute, and with a new CEO taking the helm in January 2026, the path forward remains uncertain.
We also sold our position in Atlassian. Atlassian has been hit by the broad AI-driven selloff in enterprise software, but the concerns feel more pointed here. Investors are questioning whether AI coding and workflow automation tools could erode the need for collaboration platforms like Jira and Confluence over time. There's also been recent executive turnover that has added to the uncertainty. While the business continues to grow revenue and the company's AI product is gaining traction, Atlassian’s future profits are less certain in an environment where the competitive landscape is shifting rapidly.
The above information is intended solely for current clients of Motley Fool Wealth Management (“MFWM”) for the purpose of providing insight into how we manage our strategies and our investment philosophy. This information should not be disclosed to third parties or duplicated or used for any purpose other than the purpose for which it has been provided.
All information presented herein is for informational purposes only and should not be deemed as investment advice or a recommendation to purchase or sell any specific security. This information reflects the opinions, estimates and projections of MFWM as of the date of publication, which are subject to change without notice. We do not represent that any opinion, estimate or projection will be realized. While we believe this information to be reliable, no representation or warranty is made concerning its accuracy.
Performance results are based on a representative account for each strategy, not individual client accounts. Clients can see their actual account performance on the Interactive Brokers’ website at any time. Client account results may not exactly match the performance of the representative accounts. Such variance is due to a number of factors, including differences in trade prices, transaction fees, market activity, any restrictions have you may have imposed on your account(s), and the amount and the timing of deposits or withdrawals.
The performance information presented herein has been generated during a period of extraordinary market volatility. Accordingly, the performance is not necessarily indicative of results that we may achieve in the future, and we do not represent and it cannot be assumed that the performance of our strategies will be subject to the same economic risk factors that contributed to the above returns. Performance results discussed above represent past performance, which does not guarantee future results. The investment return and principal value of an investment will fluctuate so that current performance may be lower or higher than the performance discussed above. The investment strategy and focus of our model portfolio strategies can change over time. Similarly, there is no assurance that the securities purchased will remain in a model portfolio strategy or that securities sold may not be repurchased. The mention of specific holdings does not constitute a recommendation by MFWM or its affiliates.
To the extent we invest more heavily in particular sectors or industries of the economy, the performance of our strategies will be especially sensitive to developments that significantly affect those sectors or industries. While investing in a particular sector is not a principal investment strategy of any model portfolio, client portfolios may be significantly invested in a sector or industry as a result of our portfolio management decisions. Similarly, a model portfolio’s investment may become concentrated in a small number of issuers. To the extent that we take large positions in a small number of investments, account returns may fluctuate as a result of changes in the performance of such investments to a greater extent than that of a more diversified account. Returns realized by a client account may be adversely affected if a small number of these investments perform poorly.
Index performance is discussed for illustrative purposes only as a benchmark for each strategy’s performance, and does not predict or depict performance of that strategy. While index comparisons may be useful to provide a benchmark for a strategy’s performance, it must be noted that investments are not limited to the investments comprising the indices. Each of the strategy benchmark indices are unmanaged and cannot be purchased directly by investors. It is not possible to invest in an index.
This message is provided for informational purposes only, reflects our general views on investing and should not be relied upon as recommendations or financial planning advice. We encourage you to seek personalized advice from qualified professionals, including (without limitation) tax professionals, regarding all personal finance issues. While we can counsel on tax efficiency and general tax considerations, MFWM does not (and is not permitted to) provide tax or legal advice. Clients who need such advice should consult tax and legal professionals. This message may not be relied upon as personalized financial planning or tax advice.
MFWM is an SEC registered investment advisor with a fiduciary duty that requires it to act in the best interests of clients and to place the interests of clients before its own. HOWEVER, REGISTRATION AS AN INVESTMENT ADVISOR DOES NOT IMPLY ANY LEVEL OF SKILL OR TRAINING. Access to MFWM is only available to clients pursuant to an Investment Advisory Agreement and acceptance of our Client Relationship Summary and Brochure (Form ADV, Parts 2A and 2B). You are encouraged to read these documents carefully. All investments involve risk and may lose money. MFWM does not guarantee the results of any of its advice or account management. Clients should be aware that their individual account results may not exactly match the performance of any of our Model Portfolios. Past performance is no guarantee of future results. Each Personal Portfolio is subject to an account minimum, which varies based on the strategies included in the portfolio. MFWM retains the right to revise or modify portfolios and strategies if it believes such modifications would be in the best interests of its clients.
During discussions with our Wealth Advisors, they may provide advice with respect to 401(k) and IRA rollovers into accounts that are managed by MFWM. Such recommendations pose potential conflicts of interest in that rolling retirement savings into a MFWM managed account will generate ongoing asset-based fees for MFWM that it would not otherwise receive.
Large Cap Aggressive Growth
Portfolio Managers
Tony Arsta, CFAJeremy Myers, CFA
The first quarter of 2026 was another volatile quarter for the Aggressive Growth portfolio with multiple new headwinds emerging. The quarter started with an AI-inspired sell-off in the technology sector and ended with growing concern that the conflict with Iran could spark a new wave of inflation and higher interest rates. As a result, we saw investors choose to take less risk and value-oriented stocks significantly outperform their growth peers. During the first quarter, the Large Cap Aggressive Growth strategy posted a -10.78% return, net of fees, versus an -4.33% return for its benchmark, the S&P 500®.
We were also introduced to two new investment themes that negatively impacted growth stocks. The first, the “SaaSpocolypse”, is based on the thesis that Claude and OpenAI will now allow anyone with an internet connection and a little motivation to create knock-offs of most software-as-a-service (SaaS) applications. Obviously, there’s more to the software business than writing code—things like distribution, security, maintenance, etc.—but that reality hasn’t kept investors from selling first and asking questions later. Though there are software companies that will be displaced, we think that companies with certain traits—being systems of record, serving a regulated industry, or owning proprietary data—will not only allow them to survive, but to grow by creating their own AI-powered services.
The second theme gaining traction was the acronym “HALO”, which stands for “Heavy Asset, Low Obsolescence”. This is the idea that companies that require a large pool of physical assets to operate are less likely to be disrupted by AI technology, and could even benefit from its adoption through automation. For that reason, it wasn’t a coincidence that energy, materials, and industrials happened to be the top-performing sectors year-to-date while technology and communication services were laggards. Though we think there could be some legitimacy to this thesis, it’s just as likely that the energy and materials sectors have benefited from a short-term spike in inflation expectations. If inflation actually materializes, some of those HALO gainers could be hit by increased costs and slowing global economic growth.
Throw in the conflict in Iran, which, as of this writing, is escalating by the day, and it’s difficult to formulate a clear picture of where the markets will head in the coming quarters. In these volatile times, we try to maintain focus on our disciplined approach of investing only in high-quality businesses with exceptional management teams and durable competitive advantages. Though this approach has been out of favor over the past year, we remain confident that companies with predictable revenue, high profitability, and strong cash flow should perform well over the full economic cycle.
| QTD | YTD | 1Y | 3Y | 5Y | 10Y | |
|---|---|---|---|---|---|---|
| US Large Cap Aggressive Growth | -10.78 | -10.78 | 2.02 | 13.42 | 3.76 | 13.19 |
| Benchmark (S&P 500) | -4.33 | -4.33 | 17.80 | 18.32 | 12.07 | 14.17 |
Factoring in position size and performance, the portfolio’s largest contributor and detractor were as follows:
- Equinix: 28.63% return; 4.32% weighting
- Salesforce: -29.53% return; 4.48% weighting
We believe Equinix’s strong quarter is largely attributable to better-than-expected forward guidance as the company is seeing improving demand for its data center services. The stock sputtered in 2025 after management announced increased capex spending to fuel the rapid growth in compute demand from AI companies. That forecasted demand is beginning to show up in Equinix’s bookings which are expected to accelerate through the end of the year. Longer-term we think Equinix is well-positioned as AI companies shift from training models to more distributed inference applications that require proximity to end users to minimize latency.
Despite what the company’s stock performance would suggest, Salesforce posted strong quarterly results and even showed accelerating demand for its AI-powered AgentForce services. Even so, investors have become spooked by the thesis that AI coding agents will be able to replace application software at a fraction of the cost. We think Salesforce’s position as a system of record for large organizations and its proprietary data will make its relationships stickier than expected, especially for large enterprise customers. With share prices depressed, we think Salesforce’s intended repurchase of $50 billion of stock, the largest in company history, should create shareholder value in the long term.
Transactions
During the quarter, we trimmed our Alphabet position and used those proceeds and cash on hand to add to existing positions in Netflix and ServiceNow. Alphabet has been one of our best performers over the past year and had grown into our largest position by a wide margin. For risk management purposes, we're taking some profits from a winner to fund a handful of opportunities where we see more attractive risk/reward profiles.
ServiceNow is facing negative investor sentiment despite the business executing exceptionally well, similar to the issues we highlighted for Salesforce above. The thesis from our initial purchase - that ServiceNow is uniquely positioned to monetize agentic AI through its workflow automation platform - has only gotten stronger. The company has since announced partnerships with both OpenAI and Anthropic and seen its AI-related pipeline materially expand. Also, CEO Bill McDermott has been buying shares personally, and other executives have canceled their automatic selling plans.
Our purchase of Netflix earlier this quarter turned out to be well-timed. Shares had fallen steeply as the company found itself in a bidding contest with Paramount for a portion of the Warner Bros. Discovery media assets. Our thesis was that Netflix was well-positioned regardless of outcome: if the deal closes, they acquire HBO and a century of iconic IP at a moment of weakness; if it falls through, you're left with a high-margin, low-leverage compounder at a historically cheap multiple. Everything else we like about the company – pricing power, global scale, the advertising ramp, live events – remains intact. Since Netflix management decided to bow out of the race, shares have rallied nearly 30% and you end up with streaming competitor Paramount taking on a ton of debt and likely overpaying to win the deal.
The above information is intended solely for current clients of Motley Fool Wealth Management (“MFWM”) for the purpose of providing insight into how we manage our strategies and our investment philosophy. This information should not be disclosed to third parties or duplicated or used for any purpose other than the purpose for which it has been provided.
All information presented herein is for informational purposes only and should not be deemed as investment advice or a recommendation to purchase or sell any specific security. This information reflects the opinions, estimates and projections of MFWM as of the date of publication, which are subject to change without notice. We do not represent that any opinion, estimate or projection will be realized. While we believe this information to be reliable, no representation or warranty is made concerning its accuracy.
Performance results are based on a representative account for each strategy, not individual client accounts. Clients can see their actual account performance on the Interactive Brokers’ website at any time. Client account results may not exactly match the performance of the representative accounts. Such variance is due to a number of factors, including differences in trade prices, transaction fees, market activity, any restrictions have you may have imposed on your account(s), and the amount and the timing of deposits or withdrawals.
The performance information presented herein has been generated during a period of extraordinary market volatility. Accordingly, the performance is not necessarily indicative of results that we may achieve in the future, and we do not represent and it cannot be assumed that the performance of our strategies will be subject to the same economic risk factors that contributed to the above returns. Performance results discussed above represent past performance, which does not guarantee future results. The investment return and principal value of an investment will fluctuate so that current performance may be lower or higher than the performance discussed above. The investment strategy and focus of our model portfolio strategies can change over time. Similarly, there is no assurance that the securities purchased will remain in a model portfolio strategy or that securities sold may not be repurchased. The mention of specific holdings does not constitute a recommendation by MFWM or its affiliates.
To the extent we invest more heavily in particular sectors or industries of the economy, the performance of our strategies will be especially sensitive to developments that significantly affect those sectors or industries. While investing in a particular sector is not a principal investment strategy of any model portfolio, client portfolios may be significantly invested in a sector or industry as a result of our portfolio management decisions. Similarly, a model portfolio’s investment may become concentrated in a small number of issuers. To the extent that we take large positions in a small number of investments, account returns may fluctuate as a result of changes in the performance of such investments to a greater extent than that of a more diversified account. Returns realized by a client account may be adversely affected if a small number of these investments perform poorly.
Index performance is discussed for illustrative purposes only as a benchmark for each strategy’s performance, and does not predict or depict performance of that strategy. While index comparisons may be useful to provide a benchmark for a strategy’s performance, it must be noted that investments are not limited to the investments comprising the indices. Each of the strategy benchmark indices are unmanaged and cannot be purchased directly by investors. It is not possible to invest in an index.
This message is provided for informational purposes only, reflects our general views on investing and should not be relied upon as recommendations or financial planning advice. We encourage you to seek personalized advice from qualified professionals, including (without limitation) tax professionals, regarding all personal finance issues. While we can counsel on tax efficiency and general tax considerations, MFWM does not (and is not permitted to) provide tax or legal advice. Clients who need such advice should consult tax and legal professionals. This message may not be relied upon as personalized financial planning or tax advice.
MFWM is an SEC registered investment advisor with a fiduciary duty that requires it to act in the best interests of clients and to place the interests of clients before its own. HOWEVER, REGISTRATION AS AN INVESTMENT ADVISOR DOES NOT IMPLY ANY LEVEL OF SKILL OR TRAINING. Access to MFWM is only available to clients pursuant to an Investment Advisory Agreement and acceptance of our Client Relationship Summary and Brochure (Form ADV, Parts 2A and 2B). You are encouraged to read these documents carefully. All investments involve risk and may lose money. MFWM does not guarantee the results of any of its advice or account management. Clients should be aware that their individual account results may not exactly match the performance of any of our Model Portfolios. Past performance is no guarantee of future results. Each Personal Portfolio is subject to an account minimum, which varies based on the strategies included in the portfolio. MFWM retains the right to revise or modify portfolios and strategies if it believes such modifications would be in the best interests of its clients.
During discussions with our Wealth Advisors, they may provide advice with respect to 401(k) and IRA rollovers into accounts that are managed by MFWM. Such recommendations pose potential conflicts of interest in that rolling retirement savings into a MFWM managed account will generate ongoing asset-based fees for MFWM that it would not otherwise receive.
U.S. Small & Mid-Cap
Portfolio Managers
Tony Arsta, CFANate Weisshaar, CFA
Equity markets had a rough introduction to 2026. Fears that the billions and billions in AI infrastructure investment won’t pay off hit the “Mag 7,” while missiles flying in one of the most important chokepoints on the planet (the Strait of Hormuz) made everyone skittish.
While the S&P 500 was down nearly 5% in the first quarter, the S&P Midcap 400 was up 2% thanks to its lower exposure to tech mega-caps and more exposure to energy, materials, and utilities. Unfortunately, the Small & Mid-Cap SMA didn’t enjoy this divergent performance because we try to invest in companies that we believe have sustainable competitive advantages that give them pricing power.
Energy and materials companies are almost by definition price takers; they generally produce commodity products that can be easily substituted, so we don’t often consider them for your portfolio. This burned us this quarter as the ETF was down 14%, but as I look over the companies in our portfolio, I have minimal concerns about our long-term potential.
Of course, that assumes the seas are open to free trade. With the conflict in Iran closing the Strait of Hormuz, the route for 20% of global oil and 30% of fertilizer trade was shut down. For US oil and gas producers, it was a windfall (hence the strong performance of the sector). For most of us, it means higher prices for everything from gas to food and plane tickets. But this, at least in our long-term investing framework, is only temporary. When it does resolve, energy prices should drop. Bad news for oil producers, good news for the rest of us.
Being wrong for the right reasons still means you are wrong (at least in the short term), and your portfolio managers were extremely disappointed with this quarter’s performance. Once again, we underperformed the benchmark dramatically and saw negative returns for the quarter. As we’ve said before, a single quarter is far too short a period to judge a strategy, but we never like letting our investors down, and our performance over the past year has been very disappointing when compared to the benchmark and in absolute terms.
| QTD | YTD | 1Y | 3Y | 5Y | 10Y | |
|---|---|---|---|---|---|---|
| US Small and Mid-Cap | -13.39 | -13.39 | -14.57 | 5.51 | -1.93 | 6.71 |
| Benchmark (S&P Midcap 400) | 2.50 | 2.50 | 17.35 | 12.04 | 6.90 | 10.57 |
Portfolio Review
Factoring in size and performance, the portfolio’s largest contributor and largest detractor for 2025 were:
StoneX: 27% return, 7.5% average weight
Alphatec Holdings: -48% return, 3.9% average weight
StoneX was the star of the first quarter, with shares climbing 27%. Contributing to the performance was a strong earnings report in which StoneX reported record net operating revenue, net income, and EPS. This was the first full quarter after closing the acquisition of R.J. O’Brien, and management believes that the integration of the two firms in various geographic jurisdictions around the world is going well.
Our worst performer, medical technology company Alphatec, fell 48% in the quarter despite releasing strong Q4 results in early March. In 2025, revenue grew 25% to $764 million, and management is guiding for high-teens growth in 2026. Our thesis remains intact, and in our opinion, the performance of the shares through the first quarter of the year is disconnected from the businesses’ fundamental performance.
Portfolio Changes
It was a quiet quarter in terms of trading, as no new positions were established and we didn’t exit any existing positions.
The above information is intended solely for current clients of Motley Fool Wealth Management (“MFWM”) for the purpose of providing insight into how we manage our strategies and our investment philosophy. This information should not be disclosed to third parties or duplicated or used for any purpose other than the purpose for which it has been provided.
All information presented herein is for informational purposes only and should not be deemed as investment advice or a recommendation to purchase or sell any specific security. This information reflects the opinions, estimates and projections of MFWM as of the date of publication, which are subject to change without notice. We do not represent that any opinion, estimate or projection will be realized. While we believe this information to be reliable, no representation or warranty is made concerning its accuracy.
Performance results are based on a representative account for each strategy, not individual client accounts. Clients can see their actual account performance on the Interactive Brokers’ website at any time. Client account results may not exactly match the performance of the representative accounts. Such variance is due to a number of factors, including differences in trade prices, transaction fees, market activity, any restrictions have you may have imposed on your account(s), and the amount and the timing of deposits or withdrawals.
The performance information presented herein has been generated during a period of extraordinary market volatility. Accordingly, the performance is not necessarily indicative of results that we may achieve in the future, and we do not represent and it cannot be assumed that the performance of our strategies will be subject to the same economic risk factors that contributed to the above returns. Performance results discussed above represent past performance, which does not guarantee future results. The investment return and principal value of an investment will fluctuate so that current performance may be lower or higher than the performance discussed above. The investment strategy and focus of our model portfolio strategies can change over time. Similarly, there is no assurance that the securities purchased will remain in a model portfolio strategy or that securities sold may not be repurchased. The mention of specific holdings does not constitute a recommendation by MFWM or its affiliates.
To the extent we invest more heavily in particular sectors or industries of the economy, the performance of our strategies will be especially sensitive to developments that significantly affect those sectors or industries. While investing in a particular sector is not a principal investment strategy of any model portfolio, client portfolios may be significantly invested in a sector or industry as a result of our portfolio management decisions. Similarly, a model portfolio’s investment may become concentrated in a small number of issuers. To the extent that we take large positions in a small number of investments, account returns may fluctuate as a result of changes in the performance of such investments to a greater extent than that of a more diversified account. Returns realized by a client account may be adversely affected if a small number of these investments perform poorly.
Index performance is discussed for illustrative purposes only as a benchmark for each strategy’s performance, and does not predict or depict performance of that strategy. While index comparisons may be useful to provide a benchmark for a strategy’s performance, it must be noted that investments are not limited to the investments comprising the indices. Each of the strategy benchmark indices are unmanaged and cannot be purchased directly by investors. It is not possible to invest in an index.
This message is provided for informational purposes only, reflects our general views on investing and should not be relied upon as recommendations or financial planning advice. We encourage you to seek personalized advice from qualified professionals, including (without limitation) tax professionals, regarding all personal finance issues. While we can counsel on tax efficiency and general tax considerations, MFWM does not (and is not permitted to) provide tax or legal advice. Clients who need such advice should consult tax and legal professionals. This message may not be relied upon as personalized financial planning or tax advice.
MFWM is an SEC registered investment advisor with a fiduciary duty that requires it to act in the best interests of clients and to place the interests of clients before its own. HOWEVER, REGISTRATION AS AN INVESTMENT ADVISOR DOES NOT IMPLY ANY LEVEL OF SKILL OR TRAINING. Access to MFWM is only available to clients pursuant to an Investment Advisory Agreement and acceptance of our Client Relationship Summary and Brochure (Form ADV, Parts 2A and 2B). You are encouraged to read these documents carefully. All investments involve risk and may lose money. MFWM does not guarantee the results of any of its advice or account management. Clients should be aware that their individual account results may not exactly match the performance of any of our Model Portfolios. Past performance is no guarantee of future results. Each Personal Portfolio is subject to an account minimum, which varies based on the strategies included in the portfolio. MFWM retains the right to revise or modify portfolios and strategies if it believes such modifications would be in the best interests of its clients.
During discussions with our Wealth Advisors, they may provide advice with respect to 401(k) and IRA rollovers into accounts that are managed by MFWM. Such recommendations pose potential conflicts of interest in that rolling retirement savings into a MFWM managed account will generate ongoing asset-based fees for MFWM that it would not otherwise receive.
US Stock Markets
The US Stock Markets commentary includes the following holdings: US Large Cap Strategy (Vanguard S&P 500 ETF: VOO, US Mid Cap Strategy (Vanguard Mid-Cap ETF: VO), and US Small Cap Strategy (Vanguard Small-Cap ETF: VB)
U.S. Stock Markets were down over -4% on average for the quarter with the US Large Cap Strategy (“Large Cap”), which holds VOO, down -4.4% net of ETF expenses, excluding account-level fees and expenses, during the period. Mid-Caps outperformed the broad market this quarter. The Mid Cap Strategy (“Mid Cap”), which holds VO, lost just shy of -0.7% net of ETF expenses, excluding account-level fees and expenses, during the period. Small-Caps outperformed Mid-Caps and the broad market, with the Small-Cap Strategy (“Small Cap”), which holds VB, up 1.9%, net of ETF expenses, excluding account-level fees and expenses. In general, Large Cap equity performance was roughly in line with the broader market, with the Russell 1000 down just under -4.2% in Q1. Energy and Basic Materials drove US market performance in Q1, but could not overcome headwinds from Tech, Consumer Discretionary, Financial Services, and Communications. In a continuation from Q4, Value outperformed Growth and the broad market in Q1 26. Gains in Value were led by energy. Dividend-yielding stocks also handily outperformed the broad market.
International Stock Markets
The International Stock Markets commentary includes the following holdings: International Developed Strategy (Vanguard FTSE Developed Markets ETF: VEA) and International Emerging Markets Strategy (Vanguard Emerging Markets ETF: VWO).
The Developed Markets Strategy, which holds VEA, outperformed the U.S. strategies and markedly beat the Emerging Markets strategy, which holds VWO, gaining just shy of 2.8% and 0.5% net of ETF expenses, excluding account-level fees and expenses, during Q1, respectively. Within the Developed Markets Strategy, Energy and Materials drove positive performance. Info Tech, Utilities, and Industrials also provided a boost. Within the Emerging Markets Strategy, tailwinds from Info Tech and energy were barely sufficient to beat headwinds from Communications Services and Consumer Discretionary.
US Real Estate
The US Real Estate commentary refers to the Real Estate Investment Trusts Strategy (Vanguard REIT ETF: VNQ)
The Real Estate Strategy, which holds VNQ, had a stronger quarter relative to U.S. Stocks. The Real Estate strategy was up just over 1.3% net of ETF expenses, excluding account-level fees and expenses, in Q1.
Fixed Income
U.S. Bond markets were modestly positive in the quarter, with core bonds up 0.1% for Q1. The US Bond Strategy, which holds BND, posted a gain of 0.05% for the quarter, net of ETF expenses, excluding account-level fees and expenses. Long-duration underperformed shorter- and intermediate-duration maturities in the quarter. High Yield and Corporate were comparatively weak. TIPS outperformed core bonds with the TIPS Strategy, which holds VTIP, up just under 1% in Q1, net of ETF expenses, excluding account-level fees and expenses. The Municipal Bonds strategy, which holds MUB, lagged core bonds this quarter, coming in just under -0.4% net of ETF expenses, excluding account-level fees and expenses.
The above information is intended solely for current clients of Motley Fool Wealth Management ("MFWM") for the purpose of providing insight into how we manage our strategies and our investment philosophy. This information should not be disclosed to third parties or duplicated or used for any purpose other than the purpose for which it has been provided.
PLEASE NOTE that the performance results, presented for the passive strategies/index ETFs, do not represent the performance of MFWM’s discretionary management decisions, nor does it reflect the management fee charged by Fool Wealth to manage client accounts. Third party ETFs in which we invest client assets are subject to fees and expenses (“Underlying Fund Fees”) that are separate from (and in addition to) Fool Wealth’s management fee. These Underlying Fund Fees are passed along to clients. Depending on the strategy, Underlying Fund Fees may be significant. Fool Wealth’s management fees reduce the rate of return on investments. Details of Fool Wealth’s fees for index-based portfolios can be found in Item 5(A) (1)(a) of our Brochure (“Form ADV Part 2A”).
The exchange traded funds (“ETFs”) that Fool Wealth utilizes in our index-based portfolio program are managed by third party fund managers (such as Vanguard and BlackRock) unaffiliated with Fool Wealth, TMF or our affiliates. Third party ETF managers do not pay MFWM or our affiliates any transaction-based compensation (or any other type of fee or payment) in connection with the purchase of their ETFs by Fool Wealth clients. However, clients pay transaction fees (e.g., brokerage commissions) in connection with the purchase and sale of ETFs, and may pay to their custodian account fees and other miscellaneous charges.
The performance and other information included herein were calculated by third parties. While these third parties are reputable and we believe that the information is accurate, we have not independently verified the information.
All information presented herein is for informational purposes only and should not be deemed as investment advice or a recommendation to purchase or sell any specific security. This information reflects the opinions, estimates and projections of MFWM as of the date of publication, which are subject to change without notice. We do not represent that any opinion, estimate or projection will be realized. While we believe this information to be reliable, no representation or warranty is made concerning its accuracy.