Portfolio Manager Commentary Q4 '24
Contents
Large Cap Dividend
Portfolio Managers
Tony Arsta, CFAJeremy Myers, CFA
2024 was a positive, though frustrating, year for the Dividend strategy. Similar to other lower-risk strategies, the Dividend SMA tends to earn its stripes during periods of high volatility and/or declining markets, but it tends to underperform in hot markets like we saw this year where everything seemed to rise. Add in persistently high interest rates, and the headwinds were too much for the strategy to overcome. During the fourth quarter, the Dividend strategy posted a -3.62% return, net of fees, versus a 2.41% return for its benchmark, the S&P 500®. That brings returns for the year to 9.36%, net of fees, versus 25.50% for the benchmark.
There was a brief period of optimism for the Dividend strategy in the third quarter as inflation dissipated and the Federal Reserve began lowering the federal funds rate. Value stocks rallied while growth stocks stalled, but the move was short-lived. Leading into the presidential election, interest rates started to increase again in anticipation that proposed policies from a new administration could lead to a rebound in inflation. As a result, dividend paying stocks mostly struggled in the fourth quarter, resulting in negative returns. Time will tell how these policy changes will affect interest rates, but at this point the market is pointing to a “higher for longer” path.
| QTD | YTD | 1Y | 3Y | 5Y | |
|---|---|---|---|---|---|
| US Large Cap Dividend | -3.62% | 9.36% | 9.36% | 0.87% | 7.71% |
| Benchmark (S&P 500) | 2.41% | 25.05% | 25.05% | 8.95% | 14.53% |
For both the quarter and the year, much of the Dividend strategy’s underperformance can be attributed to sector exposures. We were underweighted top-performing sectors like technology and financials and overweighted weaker-performing sectors like real estate. Though the fundamentals of the businesses we own remain strong, that was not enough to outrun the negative investor sentiment toward their respective industries. One notable exception was the utility sector, which historically has been interest rate sensitive, but more recently it has benefited from the realization that electricity generation is a critical limiting factor for AI and data center growth.
Looking forward, there seem to be more unknowns than usual regarding the economy. For that reason, we take comfort in owning what we believe are high-quality, dependable businesses that should be resilient during periods of uncertainty. Even so, we also appreciate the need to be nimble as things develop and search for opportunities to add to our collection of businesses at attractive valuations.
Portfolio Review
Factoring in size and performance, the portfolio’s largest contributor, and largest detractor, were as follows:
- Walmart: 12.13% return, 5.70% average weight
- American Tower: -19.85% return, 4.66% average weight
Walmart delivered another strong performance during the fourth quarter. From the early days of the pandemic, through the rate-tightening cycle, and now on the other side of it, Walmart has delivered value for consumers and a market-beating return for shareholders. The most recent quarterly gains are attributed to solid same-store sales growth of 5.3% and increased traffic both in-store and via e-commerce, the latter growing 22% globally year-over-year. Management continues to leverage their retail locations as fulfillment centers, allowing them to meet multi-channel demand with maximum efficiency and minimized cost. Growth in transaction volume and total tickets also reflects success in reaching higher income households and gains in market share. Though Walmart is mature, its scale, operational excellence, and dependability positions the company well to outpace peers and potentially gather additional share from dollar stores and grocers.
AMT declined nearly 20% in the fourth quarter, marking its worst quarter since 2002. While quarterly results were mixed and the stock traded lower in the following days, most of this decline occurred after the U.S. elections. Although some investors believe that a Trump presidency will lead to a reacceleration in the U.S. economy, real estate investors appear unconvinced. The S&P 500 Real Estate sector was the worst performer in the immediate aftermath of Trump’s victory, declining almost 3% despite the sharp rally in the broader market. The concern is that potential tax cuts, tariffs, and policies to crack down on immigration could potentially reaccelerate inflation and prevent further rate cuts by the Federal Reserve. Historically, valuations for tower companies have had a strong inverse correlation with U.S. 10-year Treasury yields (rising yields = falling tower valuations and stock prices). Therefore, it should come as no surprise that the sharp rally in the 10-year to close out the year, driven by these fears, was accompanied by sharp sell-off in American Tower and other real estate stocks. With the stock’s valuation currently near historical lows, we believe the market has largely priced in a worst-case scenario, leaving room for an upside surprise if things are simply “not as bad as feared.”
Portfolio Changes
During the fourth quarter we added two new positions to the portfolio: Ball Corporation and Carlisle Companies. We also sold out of our position in Starbucks and reduced our real estate sector exposure by trimming Agree Realty, Alexandria Real Estate Equities, American Tower, and Equinix to fund those purchases.
Ball Corporation is the global leader in aluminum beverage packaging, with an estimated market share of over 25%. The past few years have not been kind to Ball, with its stock still down over 40% from its all-time high set in 2021 thanks to a combination of managerial missteps, industry malaise, and a fair bit of bad luck. However, we believe management has learned from these experiences and made significant strides in righting the ship. It sold off the company’s last remaining non-core assets, closed underperforming manufacturing plants, and invested in improving the company’s operational efficiency. Going forward, we believe that the company should be able to resume growing EPS at a double-digit rate, regardless of industry growth. And while there are currently concerns regarding industry volumes as we head into 2025, we believe that any weakness will be temporary. The industry tailwinds that had resulted in aluminum gaining share over other substrates (especially plastic) prior to the pandemic are arguably stronger than ever.
Over the past several years Carlisle Companies has repositioned itself from a diversified conglomerate to a pure-play provider of building envelope solutions largely focused on commercial buildings. Its crown jewel is its commercial roofing membrane business, which is characterized by steady growth and strong margins due to a significant portion of business coming via repairs and replacements. Around this, Carlisle has acquired and developed a diverse portfolio of products including insulation, air and vapor barriers, and adhesives and sealants. Looking forward, while Carlisle isn’t totally immune to the economic cycle, we believe there are multiple tailwinds that should enable Carlisle to deliver impressive results over the next several years. These include the growing demand for energy-efficient buildings, a rapidly growing backlog of buildings requiring new roofs due to warranty expiration, and a robust pipeline of attractive acquisition targets. The company is currently targeting $40 in EPS by 2030, up from $15.52 in 2023. While this might seem aggressive to some, given the quality of the business and management team, we believe this goal is very achievable. And for what it’s worth, the company’s 2025 target that was set back in 2018 was equally as aggressive, but the company eclipsed it three years ahead of schedule.
Starbucks has stumbled over the past few years as poor strategy and multiple CEO changes resulted in slowing growth and inefficient operations. The company’s stock has rebounded strongly following the announcement that former Chipotle-CEO Brian Niccol was taking the reins. Though we agree with the new playbook he has presented, it will likely be expensive and take several quarters to show results. We think the current stock price is already pricing in a rosy outlook and it’s possible that there will be disappointment ahead, so we decided to cash in our chips and reallocate elsewhere.
The above information is intended solely for current clients of Motley Fool Wealth Management (“MFWM”) for the purpose of providing insight into how we manage our strategies and our investment philosophy. This information should not be disclosed to third parties or duplicated or used for any purpose other than the purpose for which it has been provided.
All information presented herein is for informational purposes only and should not be deemed as investment advice or a recommendation to purchase or sell any specific security. This information reflects the opinions, estimates and projections of MFWM as of the date of publication, which are subject to change without notice. We do not represent that any opinion, estimate or projection will be realized. While we believe this information to be reliable, no representation or warranty is made concerning its accuracy.
Performance results are based on a representative account for each strategy, not individual client accounts. Clients can see their actual account performance on the Interactive Brokers’ website at any time. Client account results may not exactly match the performance of the representative accounts. Such variance is due to a number of factors, including differences in trade prices, transaction fees, market activity, any restrictions have you may have imposed on your account(s), and the amount and the timing of deposits or withdrawals.
The performance information presented herein has been generated during a period of extraordinary market volatility. Accordingly, the performance is not necessarily indicative of results that we may achieve in the future, and we do not represent and it cannot be assumed that the performance of our strategies will be subject to the same economic risk factors that contributed to the above returns. Performance results discussed above represent past performance, which does not guarantee future results. The investment return and principal value of an investment will fluctuate so that current performance may be lower or higher than the performance discussed above. The investment strategy and focus of our model portfolio strategies can change over time. Similarly, there is no assurance that the securities purchased will remain in a model portfolio strategy or that securities sold may not be repurchased. The mention of specific holdings does not constitute a recommendation by MFWM or its affiliates.
To the extent we invest more heavily in particular sectors or industries of the economy, the performance of our strategies will be especially sensitive to developments that significantly affect those sectors or industries. While investing in a particular sector is not a principal investment strategy of any model portfolio, client portfolios may be significantly invested in a sector or industry as a result of our portfolio management decisions. Similarly, a model portfolio’s investment may become concentrated in a small number of issuers. To the extent that we take large positions in a small number of investments, account returns may fluctuate as a result of changes in the performance of such investments to a greater extent than that of a more diversified account. Returns realized by a client account may be adversely affected if a small number of these investments perform poorly.
Index performance is discussed for illustrative purposes only as a benchmark for each strategy’s performance, and does not predict or depict performance of that strategy. While index comparisons may be useful to provide a benchmark for a strategy’s performance, it must be noted that investments are not limited to the investments comprising the indices. Each of the strategy benchmark indices are unmanaged and cannot be purchased directly by investors. It is not possible to invest in an index.
This message is provided for informational purposes only, reflects our general views on investing and should not be relied upon as recommendations or financial planning advice. We encourage you to seek personalized advice from qualified professionals, including (without limitation) tax professionals, regarding all personal finance issues. While we can counsel on tax efficiency and general tax considerations, MFWM does not (and is not permitted to) provide tax or legal advice. Clients who need such advice should consult tax and legal professionals. This message may not be relied upon as personalized financial planning or tax advice.
MFWM is an SEC registered investment advisor with a fiduciary duty that requires it to act in the best interests of clients and to place the interests of clients before its own. HOWEVER, REGISTRATION AS AN INVESTMENT ADVISOR DOES NOT IMPLY ANY LEVEL OF SKILL OR TRAINING. Access to MFWM is only available to clients pursuant to an Investment Advisory Agreement and acceptance of our Client Relationship Summary and Brochure (Form ADV, Parts 2A and 2B). You are encouraged to read these documents carefully. All investments involve risk and may lose money. MFWM does not guarantee the results of any of its advice or account management. Clients should be aware that their individual account results may not exactly match the performance of any of our Model Portfolios. Past performance is no guarantee of future results. Each Personal Portfolio is subject to an account minimum, which varies based on the strategies included in the portfolio. MFWM retains the right to revise or modify portfolios and strategies if it believes such modifications would be in the best interests of its clients.
During discussions with our Wealth Advisors, they may provide advice with respect to 401(k) and IRA rollovers into accounts that are managed by MFWM. Such recommendations pose potential conflicts of interest in that rolling retirement savings into a MFWM managed account will generate ongoing asset-based fees for MFWM that it would not otherwise receive.
Fixed Income
Portfolio Managers
Tony Arsta, CFANate Weisshaar, CFA
Out with the old, in with the new, as they say.
But first, a bit of reflection in order to learn and move into the future on stronger footing. It seems to your portfolio managers that 2024 was a year of transition. Many market participants seem to be coming around to our view that we’ve entered a new age in interest rates – one meaningfully different than we’ve seen since the Global Financial Crisis in the late aughts.
We’ve been talking about a “higher for longer” rate environment for at least a year and now we’re starting to see other investors and commentators coming around to our view. A week before Christmas the Federal Reserve shared its latest forecast for the long-term Federal funds rate (post-2027), moving it up to 3% from 2.5% where it had been for the past three years.
That’s not terribly dramatic – and forecasts out past a year get fuzzy pretty quickly – but we think it does reflect a growing realization of changes to the global economy and what they could mean for savers and borrowers.
Additionally, with the moves in rates recently, we are starting to approach a “normal” yield curve – a generally rising line as you move from the most immediate maturities out to the longest maturities. This is considered normal because generally we expect people to be rewarded for lending their money for longer. The longer you lend out your money, the more random events can happen, which means risk is higher. Additionally, if I lend you some money for five years, that’s five years I can’t use that money for my own purposes.
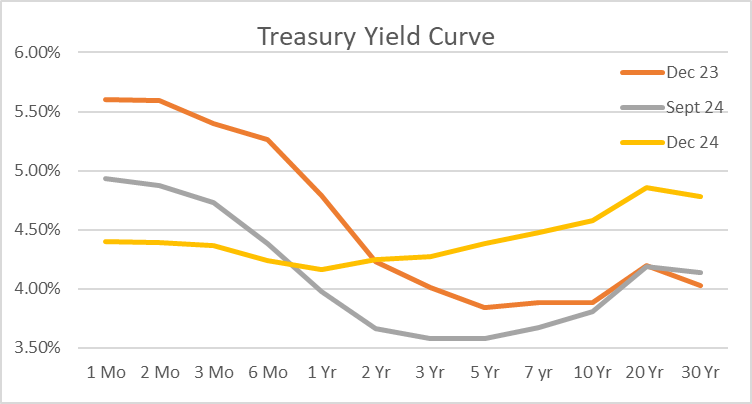
We’re still not quite there, but the Fed is currently suggesting the shortest end of the curve
will come down to ~4% by the end of 2025, so if everything else stays the same (it rarely does),
we’ll have a true normal curve in a year.
Consequently, your Fixed Income SMA remains heavily weighted toward the short end – 45% of the portfolio matures before the end of 2026. However, as mentioned last quarter, we are starting to see what we think is greater appeal in adding some longer-term exposure as we expect short-term rates will continue to come down as the FOMC attempts to return to “normal.”
With the meaningful rise in mid-to-long-term rates during the quarter, your Fixed Income SMA outperformed the Index, as expected. Our longer-term performance remains underwhelming, though we’re gaining ground as interest rates come back to historical levels.
| QTD | YTD | 1Y | 3Y | 5Y | 10Y | |
|---|---|---|---|---|---|---|
| Fixed Income | -0.98% | 3.21% | 3.21% | 0.09% | 0.21% | 0.99% |
| Bloomberg Barclays US Corporate Bond Index | -1.40% | 4.22% | 4.22% | 0.40% | 1.49% | 2.73% |
It is hard to pretend a negative net return this quarter is good, but your portfolio managers wish to remind you about the fundamental design of your Fixed Income SMA.
We’ve attempted to create an income-generating portfolio that should provide a reliable source of liquid funds for your life events or as dry powder for the equity portion of your portfolio if opportunities arise. To do this, we’re using ETF vehicles that are supposed to behave as if we’re buying bonds and holding them until they mature. At the time of writing, these maturity-date ETFs made up roughly 84% of your SMA.
Because these ETFs are highly liquid and traded on a daily basis, the price of the ETF will move daily, but for you the important part is the yield being provided and the safety of the underlying bonds. As of writing, the weighted average yield to maturity for your SMA was 5.17%.
As we’ve been saying for years, your portfolio managers haven’t felt we were getting enough reward for moving out in maturity, but as we said, 2024 was a year of transition. Recently we’ve been buying more longer-dated ETFs as interest rates have moved into what we feel is a more normal range. Today, the percentage of maturity-date ETFs maturing after 3 years is 63%, up from 41% a year ago.
We achieved this mostly in the fourth quarter when we rolled the maturing iShares iBond Dec 2024 Corporate ETF as well as portions of the iShares 0-5 Year High Yield Corporate Bond ETF and Invesco Bulletshare 2026, 2027, and 2028 Corporate Bond ETFs and put those proceeds into the 2029, 2030, 2031, and 2032 iShares and Invesco Corporate Bond ETFs.
Even as we get more comfortable with longer-dated bonds, we’re maintaining our focus on credit quality – an attractive yield isn’t very good if you lose your principal. Over 80% of your portfolio is held in investment grade securities and only 5% is in high-yield (or more risky) debt.
It took longer than we expected for the world of interest rates to return to what we believe is normal, but we’re finally seeing it. And while our reported returns in any quarter (and even year) won’t necessarily reflect it, we believe we’ve created a solid fixed income portfolio that can provide income and stability to your overall investment portfolio.
The above information is intended solely for current clients of Motley Fool Wealth Management (“MFWM”) for the purpose of providing insight into how we manage our strategies and our investment philosophy. This information should not be disclosed to third parties or duplicated or used for any purpose other than the purpose for which it has been provided.
All information presented herein is for informational purposes only and should not be deemed as investment advice or a recommendation to purchase or sell any specific security. This information reflects the opinions, estimates and projections of MFWM as of the date of publication, which are subject to change without notice. We do not represent that any opinion, estimate or projection will be realized. While we believe this information to be reliable, no representation or warranty is made concerning its accuracy.
Performance results are based on a representative account for each strategy, not individual client accounts. Clients can see their actual account performance on the Interactive Brokers’ website at any time. Client account results may not exactly match the performance of the representative accounts. Such variance is due to a number of factors, including differences in trade prices, transaction fees, market activity, any restrictions have you may have imposed on your account(s), and the amount and the timing of deposits or withdrawals.
The performance information presented herein has been generated during a period of extraordinary market volatility. Accordingly, the performance is not necessarily indicative of results that we may achieve in the future, and we do not represent and it cannot be assumed that the performance of our strategies will be subject to the same economic risk factors that contributed to the above returns. Performance results discussed above represent past performance, which does not guarantee future results. The investment return and principal value of an investment will fluctuate so that current performance may be lower or higher than the performance discussed above. The investment strategy and focus of our model portfolio strategies can change over time. Similarly, there is no assurance that the securities purchased will remain in a model portfolio strategy or that securities sold may not be repurchased. The mention of specific holdings does not constitute a recommendation by MFWM or its affiliates.
To the extent we invest more heavily in particular sectors or industries of the economy, the performance of our strategies will be especially sensitive to developments that significantly affect those sectors or industries. While investing in a particular sector is not a principal investment strategy of any model portfolio, client portfolios may be significantly invested in a sector or industry as a result of our portfolio management decisions. Similarly, a model portfolio’s investment may become concentrated in a small number of issuers. To the extent that we take large positions in a small number of investments, account returns may fluctuate as a result of changes in the performance of such investments to a greater extent than that of a more diversified account. Returns realized by a client account may be adversely affected if a small number of these investments perform poorly.
Index performance is discussed for illustrative purposes only as a benchmark for each strategy’s performance, and does not predict or depict performance of that strategy. While index comparisons may be useful to provide a benchmark for a strategy’s performance, it must be noted that investments are not limited to the investments comprising the indices. Each of the strategy benchmark indices are unmanaged and cannot be purchased directly by investors. It is not possible to invest in an index.
This message is provided for informational purposes only, reflects our general views on investing and should not be relied upon as recommendations or financial planning advice. We encourage you to seek personalized advice from qualified professionals, including (without limitation) tax professionals, regarding all personal finance issues. While we can counsel on tax efficiency and general tax considerations, MFWM does not (and is not permitted to) provide tax or legal advice. Clients who need such advice should consult tax and legal professionals. This message may not be relied upon as personalized financial planning or tax advice.
MFWM is an SEC registered investment advisor with a fiduciary duty that requires it to act in the best interests of clients and to place the interests of clients before its own. HOWEVER, REGISTRATION AS AN INVESTMENT ADVISOR DOES NOT IMPLY ANY LEVEL OF SKILL OR TRAINING. Access to MFWM is only available to clients pursuant to an Investment Advisory Agreement and acceptance of our Client Relationship Summary and Brochure (Form ADV, Parts 2A and 2B). You are encouraged to read these documents carefully. All investments involve risk and may lose money. MFWM does not guarantee the results of any of its advice or account management. Clients should be aware that their individual account results may not exactly match the performance of any of our Model Portfolios. Past performance is no guarantee of future results. Each Personal Portfolio is subject to an account minimum, which varies based on the strategies included in the portfolio. MFWM retains the right to revise or modify portfolios and strategies if it believes such modifications would be in the best interests of its clients.
During discussions with our Wealth Advisors, they may provide advice with respect to 401(k) and IRA rollovers into accounts that are managed by MFWM. Such recommendations pose potential conflicts of interest in that rolling retirement savings into a MFWM managed account will generate ongoing asset-based fees for MFWM that it would not otherwise receive.
International
Portfolio Managers
Tony Arsta, CFAMichael Olsen, CFA
The fourth quarter was a lousy one for international stocks and capped off a mediocre 2024. In Q4, developed and emerging international stocks each declined more than -7%, with notable weakness in the Eurozone, which fell about -9%. This is a stark reversal of the gains last quarter. While international markets as a group are not suffering from the sticky inflation problem the US is, and thus have a higher likelihood of falling rates, there are other issues plaguing them. What sticks out to us is lower growth, a chance of political changeovers, and the unknown impacts from changes to US trade policies. Quite frankly, this is all somewhat normal fare for international investing and keeps us focused on the underlying businesses we own and would like to own.
The International strategy matched the decline of its benchmark during the quarter but underperformed during the full year. Although results lagged, we’re excited about the changes we made to the portfolio in 2024. We added five new businesses (Nintendo, Kerry, Porsche, LSE Group, Ashtead). We believe that’s an eclectic and very high quality group of global businesses with promising outlooks and robust financial capabilities. We also sold a few lower-conviction positions and reduced the weight of regional ETFs. More than just adding diversification to a portfolio, we believe the holdings in this strategy are attractive assets in absolute and believe prospective returns could be bright.
| QTD | YTD | 1Y | 3Y | 5Y | 10Y | |
|---|---|---|---|---|---|---|
| International | -7.37% | 1.91% | 1.91% | -0.61% | 5.18% | 4.40% |
| S&P Global ex-U.S. | -7.32% | 6.01% | 6.01% | 0.94% | 4.63% | 5.50% |
Portfolio Contributors
On a weighted basis, giving effect to average weighting and absolute return, the portfolio’s largest contributor, and largest detractor, were as follows:
- Brookfield Asset Management: 15.35% return; 5.96% weighting
- Vivendi SE: -43.22% return; 1.57% weighting
Brookfield’s stock had a strong fourth quarter (up 15% in the quarter and almost 47% for the year) which can mostly be attributed to investors liking news across the private equity market that fundraising has been good. There was a fear that a higher interest rate environment would hurt alternative asset managers (like Brookfield) because a lot of their investments are funded by borrowing. However, as 2024 progressed we continued to see an appetite from investors for alternative assets. Part of this may be tied to the AI data center boom (infrastructure), part of it may be the appeal of private market companies (private equity), and part of it may be a less-bad commercial real estate environment (real estate). All of that makes Brookfield Asset Management’s investment vehicles attractive and supports continued growth in assets under management (AUM) – which drives growth in management fees and/or revenue. Whatever the particular reason, Brookfield (and its alternative asset manager brethren) caught a nice tailwind in the fourth quarter.
On the surface, Vivendi’s ADR had a horrible quarter, with the stock price down over 40%. However, the truth is that this decline was largely due to a spinoff: for every share of Vivendi, investors received one share of Canal+, Havas NV, and Louis Hachette Group while retaining their stake in Vivendi. Because investors in the ADR were unable to participate, shares of three new independent companies were sold and the proceeds will be paid as a special dividend to shareholders of the ADR. By our estimate, this accounts for roughly half of the decline in the ADR. The other half of the decline occurred prior to the spin, with the French listing of Vivendi declining roughly 20% before completion in mid-December. While it’s difficult to pinpoint exactly why this occurred, our take is that this was largely due to various investors positioning themselves in preparation for the spin since the financial results reported by the four entities were largely in line with expectations. While we were hopeful that this spin would unlock value for shareholders, as of writing, this has not been the case since the combined value of the four companies remains largely unchanged from their pre-spin value.Portfolio Activity
At the end of the quarter we added to Dublin-based clinical trials leader Icon and purchased a new position in UK-based equipment rental company Ashtead.
Shares of Icon PLC declined -27% in the quarter and fell -20% on the day it released Q3 earnings. It was a rare stinker of a quarter for the company, which suffered from lower new business wins and higher project cancellations than normal, prompting a modest lowering of 2024 revenue and earnings guidance. Project cancellations and reprioritizations are a natural part of life for Icon’s drug developing customers and this can flow through to the company’s results. We suspect shares have remained weak with the possibility of higher interest rates pressuring biotech funding and the unknown impact of Robert F. Kennedy Jr.’s appointment as the next secretary of the Department of Health and Human Services. While we are watching the situation closely to make sure nothing has materially changed in the company’s competitive position and prospects, we are encouraged by management’s support of 2025 targets and swift efficiency actions. Further, our research points to the company’s value proposition remaining highly relevant and likely to support steady growth and margin expansion over time while the company’s valuation is as low as we’ve seen it. We think the odds are in favor of good returns from here and added to our position.
Ashtead is a multinational construction, industrial, and specialty equipment rental company that operates under the Sunbelt Rentals brand. The business model is simple: Ashtead buys a broad range of equipment/machinery from equipment manufacturers, rents its fleet on a short-term basis across a large network of stores, and sells used equipment in the secondary market to keep its fleet fresh. The challenge in this model is achieving efficient asset utilization when factoring in the asset, transportation, maintenance, and rental pricing. It's complicated and Ashtead does it well. Its rental network is made up of 1,400 stores and over 1 million rental assets serving 800,000 customers.
While equipment rental is a cyclical and capital-intense industry, we believe Ashtead should continue to benefit from an improving market structure as renting continues to gain share from owning equipment (now about 55% penetrated) and the largest companies are using technology, data, and scale to outcompete the thousands of subscale local rental competitors. We think this evolution should improve industry pricing, reduce cyclical extremes, and warrant steadier and sustained higher economic returns.
Underpinning demand are unprecedented public and private investment programs to support infrastructure build, energy projects, and supply chain reshoring. For Ashtead specifically, we expect the company to resume organic growth supported by its Sunbelt 4.0 strategy, to continue making smart bolt-on acquisitions, and win its fair share of mega projects it chooses to bid on. Ashtead’s focus (relative to other large players like United and Herc) skews towards smaller customers, which have seen some struggles of late. As a result, management has reduced sales guidance and the company’s shares have taken a hit. We are accepting the near-term risk that these markets remain weak, or weaken further, for the opportunity to buy into our longer-term view of the improving industry structure and Ashtead’s leadership position in it.
The above information is intended solely for current clients of Motley Fool Wealth Management (“MFWM”) for the purpose of providing insight into how we manage our strategies and our investment philosophy. This information should not be disclosed to third parties or duplicated or used for any purpose other than the purpose for which it has been provided.
All information presented herein is for informational purposes only and should not be deemed as investment advice or a recommendation to purchase or sell any specific security. This information reflects the opinions, estimates and projections of MFWM as of the date of publication, which are subject to change without notice. We do not represent that any opinion, estimate or projection will be realized. While we believe this information to be reliable, no representation or warranty is made concerning its accuracy.
Performance results are based on a representative account for each strategy, not individual client accounts. Clients can see their actual account performance on the Interactive Brokers’ website at any time. Client account results may not exactly match the performance of the representative accounts. Such variance is due to a number of factors, including differences in trade prices, transaction fees, market activity, any restrictions have you may have imposed on your account(s), and the amount and the timing of deposits or withdrawals.
The performance information presented herein has been generated during a period of extraordinary market volatility. Accordingly, the performance is not necessarily indicative of results that we may achieve in the future, and we do not represent and it cannot be assumed that the performance of our strategies will be subject to the same economic risk factors that contributed to the above returns. Performance results discussed above represent past performance, which does not guarantee future results. The investment return and principal value of an investment will fluctuate so that current performance may be lower or higher than the performance discussed above. The investment strategy and focus of our model portfolio strategies can change over time. Similarly, there is no assurance that the securities purchased will remain in a model portfolio strategy or that securities sold may not be repurchased. The mention of specific holdings does not constitute a recommendation by MFWM or its affiliates.
To the extent we invest more heavily in particular sectors or industries of the economy, the performance of our strategies will be especially sensitive to developments that significantly affect those sectors or industries. While investing in a particular sector is not a principal investment strategy of any model portfolio, client portfolios may be significantly invested in a sector or industry as a result of our portfolio management decisions. Similarly, a model portfolio’s investment may become concentrated in a small number of issuers. To the extent that we take large positions in a small number of investments, account returns may fluctuate as a result of changes in the performance of such investments to a greater extent than that of a more diversified account. Returns realized by a client account may be adversely affected if a small number of these investments perform poorly.
Index performance is discussed for illustrative purposes only as a benchmark for each strategy’s performance, and does not predict or depict performance of that strategy. While index comparisons may be useful to provide a benchmark for a strategy’s performance, it must be noted that investments are not limited to the investments comprising the indices. Each of the strategy benchmark indices are unmanaged and cannot be purchased directly by investors. It is not possible to invest in an index.
This message is provided for informational purposes only, reflects our general views on investing and should not be relied upon as recommendations or financial planning advice. We encourage you to seek personalized advice from qualified professionals, including (without limitation) tax professionals, regarding all personal finance issues. While we can counsel on tax efficiency and general tax considerations, MFWM does not (and is not permitted to) provide tax or legal advice. Clients who need such advice should consult tax and legal professionals. This message may not be relied upon as personalized financial planning or tax advice.
MFWM is an SEC registered investment advisor with a fiduciary duty that requires it to act in the best interests of clients and to place the interests of clients before its own. HOWEVER, REGISTRATION AS AN INVESTMENT ADVISOR DOES NOT IMPLY ANY LEVEL OF SKILL OR TRAINING. Access to MFWM is only available to clients pursuant to an Investment Advisory Agreement and acceptance of our Client Relationship Summary and Brochure (Form ADV, Parts 2A and 2B). You are encouraged to read these documents carefully. All investments involve risk and may lose money. MFWM does not guarantee the results of any of its advice or account management. Clients should be aware that their individual account results may not exactly match the performance of any of our Model Portfolios. Past performance is no guarantee of future results. Each Personal Portfolio is subject to an account minimum, which varies based on the strategies included in the portfolio. MFWM retains the right to revise or modify portfolios and strategies if it believes such modifications would be in the best interests of its clients.
During discussions with our Wealth Advisors, they may provide advice with respect to 401(k) and IRA rollovers into accounts that are managed by MFWM. Such recommendations pose potential conflicts of interest in that rolling retirement savings into a MFWM managed account will generate ongoing asset-based fees for MFWM that it would not otherwise receive.
Large Cap Core
Portfolio Managers
Tony Arsta, CFAJeremy Myers, CFA
The Large Cap Core strategy finished the year with healthy returns, though it trailed the overall market in what turned out to be another year of outstanding performance. During the fourth quarter, the Large Cap Core strategy posted a 2.02% return, net of fees, versus a 2.41% return for its benchmark, the S&P 500®. That brings returns for the year to 17.98%, net of fees, versus 25.05% for the benchmark.
Growth stocks handily outperformed value stocks this year, with the technology, communication services, and consumer discretionary sectors leading the way. Mega cap tech stocks, like Meta, Google, and Salesforce were the biggest contributors to our performance this year while our healthcare and real estate positions were the biggest drag on performance. Unfortunately, we did not have a position in Nvidia whose 170% gain contributed over 22% of the market’s gains during the year and made it difficult for our portfolio to keep pace.
| QTD | YTD | 1Y | 3Y | 5Y | 10Y | |
|---|---|---|---|---|---|---|
| US Large Cap Core | 2.02% | 17.98% | 17.98% | 6.25% | 13.29% | 13.55% |
| Benchmark (S&P 500) | 2.41% | 25.05% | 25.05% | 8.95% | 14.53% | 13.11% |
Looking forward, we expect returns to be a little bit more difficult to come by compared to the past year where everything seemed to be rising. Though stocks have cheered the expectations of lower corporate taxes and less regulation, big questions remain regarding the potential impacts that tariffs and mass deportations could have on the economy. We will be watching carefully as the year progresses, but we’re happy to own what we believe are high-quality businesses with solid management teams to navigate whatever 2025 throws at us. You can also trust that we will continue to scour the market, searching for new opportunities to add to the portfolio to help drive future returns.
Portfolio Review
Factoring in size and performance, the portfolio’s largest contributor, and largest detractor, were as follows:
- Booking Holdings: 18.15% return, 7.05% average weight
- American Tower: -19.85% return, 3.49% average weight
Booking was the top performer in the quarter thanks to 3Q earnings that were better than expected. Gross bookings grew 9% year-on-year on improved European travel demand, stronger flight ticket growth and an expanded booking window. Adjusted net profit increased 9% year-on-year to $2.84 billion and combined with continued share repurchases (the quarter saw a 6% year-on-year reduction in share count), adjusted EPS increased 16% compared to last year. We also liked to see Booking gain ground in the alternative accommodation market where it delivered nights booked growth of 14% over last year and has reached 2/3 the size of Airbnb. Shares have performed well with BKNG up 41% in 2024. However, with the stock now sitting at the higher end of its valuation range plus the travel industry’s exposure to macro conditions, we will be monitoring BKNG more closely. We still view Booking as a solid core holding given the company’s leadership position and long growth runway in online travel, strong management, and buybacks that will support EPS growth.
AMT declined nearly 20% in the fourth quarter, marking its worst quarter since 2002. While quarterly results were mixed and the stock traded lower in the following days, the majority of this decline occurred after the U.S. elections. Although some investors believe that a Trump presidency will lead to a reacceleration in the U.S. economy, real estate investors appear unconvinced. The S&P 500 Real Estate sector was the worst performer in the immediate aftermath of Trump’s victory, declining almost 3% despite the sharp rally in the broader market. The concern is that potential tax cuts, tariffs, and policies to crack down on immigration could potentially reaccelerate inflation and prevent further rate cuts by the Federal Reserve. Historically, valuations for tower companies have had a strong inverse correlation with U.S. 10-year Treasury yields (rising yields = falling tower valuations and stock prices). Therefore, it should come as no surprise that the sharp rally in the 10-year to close out the year, driven by these fears, was accompanied by sharp sell-off in American Tower and other real estate stocks. With the stock’s valuation currently near historical lows, we believe the market has largely priced in a worst-case scenario, leaving room for an upside surprise if things are simply “not as bad as feared.”
Portfolio Changes
During the fourth quarter we added three new positions to the portfolio: Ball Corporation, Carlisle Companies, and Micron. We also sold out of our position in Starbucks and trimmed American Tower, Equinix, and Meta to fund those purchases.
Ball Corporation is the global leader in aluminum beverage packaging, with an estimated market share of over 25%. The past few years have not been kind to Ball, with its stock still down over 40% from its all-time high set in 2021 thanks to a combination of managerial missteps, industry malaise, and a fair bit of bad luck. However, we believe management has learned from these experiences and made significant strides in righting the ship. It sold off the company’s last remaining non-core asset, closed underperforming manufacturing plants, and invested in improving the company’s operational efficiency. Going forward, we believe that the company should be able to resume growing EPS at a double-digit rate, regardless of industry growth. And while there are currently concerns regarding industry volumes as we head into 2025, we believe that any weakness will be temporary. The industry tailwinds that had resulted in aluminum gaining share over other substrates (especially plastic) prior to the pandemic are arguably stronger than ever.
Over the past several years Carlisle Companies has repositioned itself from a diversified conglomerate to a pure-play provider of building envelope solutions largely focused on commercial buildings. Its crown jewel is its commercial roofing membrane business, which is characterized by steady growth and strong margins due to a significant portion of business coming via repairs and replacement. Around this, Carlisle has acquired and developed a diverse portfolio of products including insulation, air and vapor barriers, and adhesives and sealants. Looking forward, while Carlisle isn’t totally immune to the economic cycle, we believe there are multiple tailwinds that could enable Carlisle to deliver impressive results over the next several years. These include the growing demand for energy-efficient buildings, a rapidly growing backlog of buildings requiring new roofs due to warranty expiration, and a robust pipeline of attractive acquisition targets. The company is currently targeting $40 in EPS by 2030, up from $15.52 in 2023. While this might seem aggressive to some, given the quality of the business and management team we believe this goal is very achievable. And for what it’s worth, the company’s 2025 target that was set back in 2018 was equally as aggressive, but the company eclipsed it three years ahead of schedule.
In October, we initiated a position in Micron, the number three player in the computer memory space after Samsung, the largest player, issued an apology to its shareholders for a failure to deliver on innovation. This was largely related to Samsung missing out on the boom in high-bandwidth memory (HBM), a vital component to AI computing. Samsung failed to deliver its HBM product in the quality and quantity that Nvidia required, so we believe that opened the door for Micron to take market share over the next couple years as the AI boom continues. There aren’t a lot of secrets in the AI-related investing space these days, but we believe the market has failed to appreciate how quickly chip innovation is happening in the space and what it means for companies like Micron and Samsung to be included (or not). We think Micron’s competitive, leading-edge memory gives them a good chance to move up from number three to number two, at least when it comes to AI-related memory products.
Starbucks has stumbled over the past few years as poor strategy and multiple CEO changes resulted in slowing growth and inefficient operations. The company’s stock has rebounded strongly following the announcement that former Chipotle-CEO Brian Niccol was taking the reins. While we agree with the new playbook he has presented, it will likely be expensive to implement and take several quarters to show results. We think the current stock price is already pricing in a rosy outlook, and it’s possible that there will be disappointment ahead, so we decided to cash in our chips and reallocate elsewhere.
The above information is intended solely for current clients of Motley Fool Wealth Management (“MFWM”) for the purpose of providing insight into how we manage our strategies and our investment philosophy. This information should not be disclosed to third parties or duplicated or used for any purpose other than the purpose for which it has been provided.
All information presented herein is for informational purposes only and should not be deemed as investment advice or a recommendation to purchase or sell any specific security. This information reflects the opinions, estimates and projections of MFWM as of the date of publication, which are subject to change without notice. We do not represent that any opinion, estimate or projection will be realized. While we believe this information to be reliable, no representation or warranty is made concerning its accuracy.
Performance results are based on a representative account for each strategy, not individual client accounts. Clients can see their actual account performance on the Interactive Brokers’ website at any time. Client account results may not exactly match the performance of the representative accounts. Such variance is due to a number of factors, including differences in trade prices, transaction fees, market activity, any restrictions have you may have imposed on your account(s), and the amount and the timing of deposits or withdrawals.
The performance information presented herein has been generated during a period of extraordinary market volatility. Accordingly, the performance is not necessarily indicative of results that we may achieve in the future, and we do not represent and it cannot be assumed that the performance of our strategies will be subject to the same economic risk factors that contributed to the above returns. Performance results discussed above represent past performance, which does not guarantee future results. The investment return and principal value of an investment will fluctuate so that current performance may be lower or higher than the performance discussed above. The investment strategy and focus of our model portfolio strategies can change over time. Similarly, there is no assurance that the securities purchased will remain in a model portfolio strategy or that securities sold may not be repurchased. The mention of specific holdings does not constitute a recommendation by MFWM or its affiliates.
To the extent we invest more heavily in particular sectors or industries of the economy, the performance of our strategies will be especially sensitive to developments that significantly affect those sectors or industries. While investing in a particular sector is not a principal investment strategy of any model portfolio, client portfolios may be significantly invested in a sector or industry as a result of our portfolio management decisions. Similarly, a model portfolio’s investment may become concentrated in a small number of issuers. To the extent that we take large positions in a small number of investments, account returns may fluctuate as a result of changes in the performance of such investments to a greater extent than that of a more diversified account. Returns realized by a client account may be adversely affected if a small number of these investments perform poorly.
Index performance is discussed for illustrative purposes only as a benchmark for each strategy’s performance, and does not predict or depict performance of that strategy. While index comparisons may be useful to provide a benchmark for a strategy’s performance, it must be noted that investments are not limited to the investments comprising the indices. Each of the strategy benchmark indices are unmanaged and cannot be purchased directly by investors. It is not possible to invest in an index.
This message is provided for informational purposes only, reflects our general views on investing and should not be relied upon as recommendations or financial planning advice. We encourage you to seek personalized advice from qualified professionals, including (without limitation) tax professionals, regarding all personal finance issues. While we can counsel on tax efficiency and general tax considerations, MFWM does not (and is not permitted to) provide tax or legal advice. Clients who need such advice should consult tax and legal professionals. This message may not be relied upon as personalized financial planning or tax advice.
MFWM is an SEC registered investment advisor with a fiduciary duty that requires it to act in the best interests of clients and to place the interests of clients before its own. HOWEVER, REGISTRATION AS AN INVESTMENT ADVISOR DOES NOT IMPLY ANY LEVEL OF SKILL OR TRAINING. Access to MFWM is only available to clients pursuant to an Investment Advisory Agreement and acceptance of our Client Relationship Summary and Brochure (Form ADV, Parts 2A and 2B). You are encouraged to read these documents carefully. All investments involve risk and may lose money. MFWM does not guarantee the results of any of its advice or account management. Clients should be aware that their individual account results may not exactly match the performance of any of our Model Portfolios. Past performance is no guarantee of future results. Each Personal Portfolio is subject to an account minimum, which varies based on the strategies included in the portfolio. MFWM retains the right to revise or modify portfolios and strategies if it believes such modifications would be in the best interests of its clients.
During discussions with our Wealth Advisors, they may provide advice with respect to 401(k) and IRA rollovers into accounts that are managed by MFWM. Such recommendations pose potential conflicts of interest in that rolling retirement savings into a MFWM managed account will generate ongoing asset-based fees for MFWM that it would not otherwise receive.
Hedged Equity
Portfolio Managers
JP Bennett, CFAMichael Olsen, CFA
Markets treaded water in October waiting for clarity on the US election. Then, swiftly, in anticipation of the winning party’s expected pro-growth economic agenda (including lower taxes and regulations), the S&P 500 advanced 5%. December dampened the good vibes, though, when the US Federal Reserve suggested fewer rate cuts in coming years as inflation remains sticky. Investors continue to cope with the possibility of interest rates that remain higher for longer. As the calendar flipped, US stocks were still up a bit over 2% for the quarter, led by growth and large cap stocks. International stocks lagged badly, with particular weakness in Europe.
The Hedged Equity strategy performed well, gaining 3.24% versus 1.72% for its benchmark. Given our international tilt and relative underweight to megacap growth, we’re pleased with this performance.
| QTD | YTD | 1Y | 3Y | 5Y | 10Y | |
|---|---|---|---|---|---|---|
| US Large Cap Core | 2.02% | 17.98% | 17.98% | 6.25% | 13.29% | 13.55% |
| Benchmark (S&P 500) | 2.41% | 25.05% | 25.05% | 8.95% | 14.53% | 13.11% |
Portfolio Review
Factoring in size and performance, the portfolio’s largest contributor, and largest detractor, were as follows:
- Axon Enterprise: 48.73% return, 7.41% average weight
- Icon PLC: -27.01% return, 3.79% average weight
Axon finished off 2024 with gusto when it delivered its third quarter earnings report in early November. The company grew revenue by nearly 32% year-over-year with Axon Cloud & Service growing 36% year-over-year. What’s particularly noteworthy is that this report marked the 11th consecutive quarter of growth above 25%. Strength was seen mostly across the board with TASER 10 leading the charge, followed by solid growth in body worn cameras, both of which were offset by a decline in Axon Fleet. All-in, net income came in at $67 million, yielding a 12.3% margin. We continue to view Axon as an innovative category leader providing a holistic ecosystem of hardware and software solutions to the public safety community, and therefore maintain a meaningful stake in the company.
Dublin-based outsourced medical trials leader Icon PLC declined -27% in the quarter. It was a rare stinker of a quarter for the company, which suffered from lower new business wins and higher project cancellations than normal, prompting a modest lowering of 2024 revenue and earnings guidance. On the back of a competitor experiencing weakness in earlier-stage markets, investors punished Icon shares. Project cancellations and reprioritizations are a natural part of life for Icon’s drug developing customers and this can flow through to the company’s results. We suspect shares have remained weak with the possibility of higher interest rates pressuring biotech funding and the unknown impact of Robert F. Kennedy Jr.’s appointment as the next secretary of the Department of Health and Human Services. While we are watching the situation closely to make sure nothing has materially changed in the company’s competitive position and prospects, we are encouraged by management’s support of 2025 targets and swift efficiency actions.
Portfolio Changes
Towards the end of the quarter we made some portfolio changes. The net impact of these changes modestly increased net exposure, still in the bounds of normalcy, while eliminating a few lower-conviction holdings and adding to two beaten-down higher conviction ones.
One hallmark trait we look for in long holdings is clear evidence that the company's advantages are expanding. We sold our small position in Inari Medical and long-time position in Comcast because we were no longer confident that is the case. We still think great things are ahead for Inari's lifesaving products. However, we expected more dominant market share gains than we have seen so far which suggests to us a more intense competitive environment or narrower product superiority. When we entered our position in Comcast, our belief was that competitive threats to the company's broadband offering were overblown and inferior, and that in time the customer and market would acknowledge that. This has not happened, and we haven't seen evidence that it will, suggesting to us that at best Comcast's broadband advantages are holding ground, but not getting better.
We also trimmed collaboration software champion Atlassian and public safety outfitter Axon after their stocks surged 49% and 53%, respectively, in the quarter. These trims move the positions to more appropriate weightings given our view of their risks, valuation and prospects.
We also closed out our shorts on Restaurant Brands, Dicks Sporting Goods, Lululemon, and Aaon. These were situations where our thesis has played out or failed to materialize. These are all fairly small positions, and we lack conviction that they will be meaningful contributors to returns or offsets to remaining portfolio risks.
We added to two positions that have been recent laggards. Icon, which we wrote about above, represents a very attractive opportunity provided that our long term hypothesis around further clinical trial outsourcing holds up. At this point, we’re confident in adding to this position as expectations are low and we think the company should do just fine even in a tougher outsourcing and demand environment. In our eyes, Universal Music Group looks appealing, too. Several quarters ago shares sold off on lower-than-expected subscriber growth as investors worried music streaming subscription penetration was stalling. Since then, UMG has seen subscription growth that was just fine, and its major public competitor, Warner, has further supported the idea that UMGs performance was just a hiccup. We remain confident in the future of streaming music subscriptions, the value of music catalogs, and the advantages of the major labels.
The above information is intended solely for current clients of Motley Fool Wealth Management (“MFWM”) for the purpose of providing insight into how we manage our strategies and our investment philosophy. This information should not be disclosed to third parties or duplicated or used for any purpose other than the purpose for which it has been provided.
All information presented herein is for informational purposes only and should not be deemed as investment advice or a recommendation to purchase or sell any specific security. This information reflects the opinions, estimates and projections of MFWM as of the date of publication, which are subject to change without notice. We do not represent that any opinion, estimate or projection will be realized. While we believe this information to be reliable, no representation or warranty is made concerning its accuracy.
Performance results are based on a representative account for each strategy, not individual client accounts. Clients can see their actual account performance on the Interactive Brokers’ website at any time. Client account results may not exactly match the performance of the representative accounts. Such variance is due to a number of factors, including differences in trade prices, transaction fees, market activity, any restrictions have you may have imposed on your account(s), and the amount and the timing of deposits or withdrawals.
The performance information presented herein has been generated during a period of extraordinary market volatility. Accordingly, the performance is not necessarily indicative of results that we may achieve in the future, and we do not represent and it cannot be assumed that the performance of our strategies will be subject to the same economic risk factors that contributed to the above returns. Performance results discussed above represent past performance, which does not guarantee future results. The investment return and principal value of an investment will fluctuate so that current performance may be lower or higher than the performance discussed above. The investment strategy and focus of our model portfolio strategies can change over time. Similarly, there is no assurance that the securities purchased will remain in a model portfolio strategy or that securities sold may not be repurchased. The mention of specific holdings does not constitute a recommendation by MFWM or its affiliates.
To the extent we invest more heavily in particular sectors or industries of the economy, the performance of our strategies will be especially sensitive to developments that significantly affect those sectors or industries. While investing in a particular sector is not a principal investment strategy of any model portfolio, client portfolios may be significantly invested in a sector or industry as a result of our portfolio management decisions. Similarly, a model portfolio’s investment may become concentrated in a small number of issuers. To the extent that we take large positions in a small number of investments, account returns may fluctuate as a result of changes in the performance of such investments to a greater extent than that of a more diversified account. Returns realized by a client account may be adversely affected if a small number of these investments perform poorly.
Index performance is discussed for illustrative purposes only as a benchmark for each strategy’s performance, and does not predict or depict performance of that strategy. While index comparisons may be useful to provide a benchmark for a strategy’s performance, it must be noted that investments are not limited to the investments comprising the indices. Each of the strategy benchmark indices are unmanaged and cannot be purchased directly by investors. It is not possible to invest in an index.
This message is provided for informational purposes only, reflects our general views on investing and should not be relied upon as recommendations or financial planning advice. We encourage you to seek personalized advice from qualified professionals, including (without limitation) tax professionals, regarding all personal finance issues. While we can counsel on tax efficiency and general tax considerations, MFWM does not (and is not permitted to) provide tax or legal advice. Clients who need such advice should consult tax and legal professionals. This message may not be relied upon as personalized financial planning or tax advice.
MFWM is an SEC registered investment advisor with a fiduciary duty that requires it to act in the best interests of clients and to place the interests of clients before its own. HOWEVER, REGISTRATION AS AN INVESTMENT ADVISOR DOES NOT IMPLY ANY LEVEL OF SKILL OR TRAINING. Access to MFWM is only available to clients pursuant to an Investment Advisory Agreement and acceptance of our Client Relationship Summary and Brochure (Form ADV, Parts 2A and 2B). You are encouraged to read these documents carefully. All investments involve risk and may lose money. MFWM does not guarantee the results of any of its advice or account management. Clients should be aware that their individual account results may not exactly match the performance of any of our Model Portfolios. Past performance is no guarantee of future results. Each Personal Portfolio is subject to an account minimum, which varies based on the strategies included in the portfolio. MFWM retains the right to revise or modify portfolios and strategies if it believes such modifications would be in the best interests of its clients.
During discussions with our Wealth Advisors, they may provide advice with respect to 401(k) and IRA rollovers into accounts that are managed by MFWM. Such recommendations pose potential conflicts of interest in that rolling retirement savings into a MFWM managed account will generate ongoing asset-based fees for MFWM that it would not otherwise receive.
Large Cap Aggressive Growth
Portfolio Managers
Tony Arsta, CFAJeremy Myers, CFA
The Aggressive Growth portfolio finished the year on a high note, but it still could not close the gap on the benchmark for the full year. During the fourth quarter, the Large Cap Aggressive Growth strategy posted a 5.23% return, net of fees, versus an 2.41% return for its benchmark, the S&P 500®. That brings returns for the year to 18.59%, net of fees, versus 25.05% for the benchmark.
2024 was a strong year for growth stocks, which nearly doubled the returns of their value-oriented peers. The technology, communications services, and consumer discretionary sectors were all leaders, which drove much of the performance for the Aggressive Growth strategy. Unfortunately, we did not have a position in Nvidia whose 170% gain contributed over 22% of the market’s gains during the year and made it difficult for our portfolio to keep pace. We also had little exposure to the financial sector, which rallied strongly as the yield curve steepened in the second half. Our healthcare and biotech holdings were also weak performers. This was in line with the overall healthcare sector which, with the exception of the GLP-1 drug providers, has been in a bit of a malaise following the pandemic.
| QTD | YTD | 1Y | 3Y | 5Y | 10Y | |
|---|---|---|---|---|---|---|
| US Large Cap Aggressive Growth | 5.23% | 18.59% | 18.59% | 5.89% | 13.26% | 12.95% |
| Benchmark (S&P 500) | 2.41% | 25.05% | 25.05% | 8.95% | 14.53% | 13.11% |
Overall, we are pleased with the performance of the businesses we own and believe that we are well-positioned for the year ahead, despite many unknowns. Two years of 20%-plus returns for the market is highly unusual, having occurred only three other times in the past 100 years. The only time the market strung three such years together was during the tech bubble of the late-90s, which suggests to us returns could be harder to come by this year. Between the policy changes of the new administration and the enthusiasm surrounding recent AI breakthroughs, anything could happen, and we hope to capitalize on any price dislocations the market may present.
Portfolio Review
Factoring in size and performance, the portfolio’s largest contributor, and largest detractor, were as follows:
- Amazon: 17.74% return, 11.27% average weight
- MercadoLibre: -17.13% return, 6.86% average weight
It’s always a good thing when one of the largest holdings in the portfolio is also a leading performer. Amazon’s stock finished the year on a high note after posting weaker performance in the third quarter. Strong third quarter results coupled with upbeat fourth quarter guidance helped the company outpace the market by a wide margin. Amazon Web Services (AWS) continues to benefit from a surge in AI-related spending on cloud infrastructure causing revenue growth to accelerate sequentially for the fifth quarter in a row. Consumer spending is also more resilient than anticipated, which has helped the e-commerce business deliver strong results. Most importantly, efforts to improve efficiency have resulted in lower costs and better-than-expected operating profits, which makes us optimistic that the company could continue to see improving operating margins going forward.
MercadoLibre’s stock price pulled back in the fourth quarter, but the company still finished slightly higher for the year. The South American e-commerce giant continues to grow at a rapid clip, but the stock is richly valued and any blip in performance usually results in a big move in the stock price. In this case, MercadoLibre reported disappointing margins due to accelerating credit originations that require the company to expense upfront credit loss previsions while recognizing the associated revenue over time. The company is also investing heavily in new fulfillment centers to support its rapid commerce growth. Despite the near-term margin hit, these investments and growth opportunities should be a good thing for the business in the long-term. All-in-all, we believe this quarter will be a small bump in a solid long-term growth story.
Portfolio Changes
In October, we initiated a position in Micron, the number three player in the computer memory space after Samsung, the largest player, issued an apology to its shareholders for a failure to deliver on innovation. This was largely related to Samsung missing out on the boom in high-bandwidth memory (HBM), a vital component to AI computing. Samsung failed to deliver its HBM product in the quality and quantity that Nvidia required, so we believe that opened the door for Micron to take market share over the next couple years as the AI boom continues.
There aren’t a lot of secrets in the AI-related investing space these days, but we believe the market has failed to appreciate how quickly chip innovation is happening in the space and what it means for companies like Micron and Samsung to be included (or not). We think Micron’s competitive, leading-edge memory gives them a good chance to move up from number three to number two, at least when it comes to AI-related memory products.
To raise cash for the Micron purchase we trimmed our position in Amazon. Though Amazon will remain our largest position, we think this is a prudent way to help limit our overall exposure to the technology sector and not overexpose the portfolio to swings in investor sentiment toward AI-related companies
The above information is intended solely for current clients of Motley Fool Wealth Management (“MFWM”) for the purpose of providing insight into how we manage our strategies and our investment philosophy. This information should not be disclosed to third parties or duplicated or used for any purpose other than the purpose for which it has been provided.
All information presented herein is for informational purposes only and should not be deemed as investment advice or a recommendation to purchase or sell any specific security. This information reflects the opinions, estimates and projections of MFWM as of the date of publication, which are subject to change without notice. We do not represent that any opinion, estimate or projection will be realized. While we believe this information to be reliable, no representation or warranty is made concerning its accuracy.
Performance results are based on a representative account for each strategy, not individual client accounts. Clients can see their actual account performance on the Interactive Brokers’ website at any time. Client account results may not exactly match the performance of the representative accounts. Such variance is due to a number of factors, including differences in trade prices, transaction fees, market activity, any restrictions have you may have imposed on your account(s), and the amount and the timing of deposits or withdrawals.
The performance information presented herein has been generated during a period of extraordinary market volatility. Accordingly, the performance is not necessarily indicative of results that we may achieve in the future, and we do not represent and it cannot be assumed that the performance of our strategies will be subject to the same economic risk factors that contributed to the above returns. Performance results discussed above represent past performance, which does not guarantee future results. The investment return and principal value of an investment will fluctuate so that current performance may be lower or higher than the performance discussed above. The investment strategy and focus of our model portfolio strategies can change over time. Similarly, there is no assurance that the securities purchased will remain in a model portfolio strategy or that securities sold may not be repurchased. The mention of specific holdings does not constitute a recommendation by MFWM or its affiliates.
To the extent we invest more heavily in particular sectors or industries of the economy, the performance of our strategies will be especially sensitive to developments that significantly affect those sectors or industries. While investing in a particular sector is not a principal investment strategy of any model portfolio, client portfolios may be significantly invested in a sector or industry as a result of our portfolio management decisions. Similarly, a model portfolio’s investment may become concentrated in a small number of issuers. To the extent that we take large positions in a small number of investments, account returns may fluctuate as a result of changes in the performance of such investments to a greater extent than that of a more diversified account. Returns realized by a client account may be adversely affected if a small number of these investments perform poorly.
Index performance is discussed for illustrative purposes only as a benchmark for each strategy’s performance, and does not predict or depict performance of that strategy. While index comparisons may be useful to provide a benchmark for a strategy’s performance, it must be noted that investments are not limited to the investments comprising the indices. Each of the strategy benchmark indices are unmanaged and cannot be purchased directly by investors. It is not possible to invest in an index.
This message is provided for informational purposes only, reflects our general views on investing and should not be relied upon as recommendations or financial planning advice. We encourage you to seek personalized advice from qualified professionals, including (without limitation) tax professionals, regarding all personal finance issues. While we can counsel on tax efficiency and general tax considerations, MFWM does not (and is not permitted to) provide tax or legal advice. Clients who need such advice should consult tax and legal professionals. This message may not be relied upon as personalized financial planning or tax advice.
MFWM is an SEC registered investment advisor with a fiduciary duty that requires it to act in the best interests of clients and to place the interests of clients before its own. HOWEVER, REGISTRATION AS AN INVESTMENT ADVISOR DOES NOT IMPLY ANY LEVEL OF SKILL OR TRAINING. Access to MFWM is only available to clients pursuant to an Investment Advisory Agreement and acceptance of our Client Relationship Summary and Brochure (Form ADV, Parts 2A and 2B). You are encouraged to read these documents carefully. All investments involve risk and may lose money. MFWM does not guarantee the results of any of its advice or account management. Clients should be aware that their individual account results may not exactly match the performance of any of our Model Portfolios. Past performance is no guarantee of future results. Each Personal Portfolio is subject to an account minimum, which varies based on the strategies included in the portfolio. MFWM retains the right to revise or modify portfolios and strategies if it believes such modifications would be in the best interests of its clients.
During discussions with our Wealth Advisors, they may provide advice with respect to 401(k) and IRA rollovers into accounts that are managed by MFWM. Such recommendations pose potential conflicts of interest in that rolling retirement savings into a MFWM managed account will generate ongoing asset-based fees for MFWM that it would not otherwise receive.
U.S. Small & Mid-Cap
Portfolio Managers
Tony Arsta, CFANate Weisshaar, CFA
Large cap stocks, once again, had all the fun. Mid caps were flat and small caps declined a bit over -1% in the fourth quarter. That didn’t stop your US Small and Mid Cap SMA from capping off a nice year by rising 3.81% in the fourth quarter.
We suspect the thing weighing on smaller capitalization stocks the most was December commentary from the Fed regarding its willingness to slow its effort to lower interest rates in an effort to deal with stubborn inflation. Broadly, mid and small cap companies feel these effects more acutely than large caps, so the unexpected news hit them a bit harder during the quarter. The other piece of the puzzle, here, is that large cap earnings growth continues to outpace mid and small caps – for now.
| QTD | YTD | 1Y | 3Y | 5Y | 10Y | |
|---|---|---|---|---|---|---|
| US Small and Mid-Cap | 3.81% | 21.65% | 21.65% | 1.40% | 7.48% | 7.20% |
| Benchmark (S&P Midcap 400) | 0.35% | 13.78% | 13.78% | 4.83% | 10.31% | 9.67% |
As we look ahead, earnings growth rate estimates for mid caps are higher than for large caps each of the next four quarters, and earnings growth from small caps is expected to lead all camps in quarters two, three, and four. We shall see if those expectations come to pass. In the meantime, we can observe the current forward price-earnings multiple for the S&P 500 (large caps) is about 23 and for the S&P 400 (mid caps) is about 18. Accelerating expected growth and a reasonable valuation is a nice way to enter 2025 for mid caps.
Portfolio Review
Factoring in size and performance, the portfolio’s largest contributor, and largest detractor, were as follows:
- Axon Enterprise: 48.73% return, 5.76% average weight
- Crocs: -24.36% return, 1.71% average weight
Axon finished off 2024 with gusto when it delivered its third quarter earnings report in early November. The company grew revenue by nearly 32% year-over-year with Axon Cloud & Service growing 36% year-over-year. What’s particularly noteworthy is that this report marked the 11th consecutive quarter of growth above 25%. Strength was seen mostly across the board with TASER 10 leading the charge, followed by solid growth in body-worn cameras, both of which were offset by a decline in Axon Fleet. All-in, net income came in at $67 million, yielding a 12.3% margin. We continue to view Axon as an innovative category leader providing a holistic ecosystem of hardware and software solutions to the public safety community, and therefore maintain a meaningful stake in the company.
Crocs was our bottom performer in the quarter. Shares in the branded footwear company declined 24% versus the S&P 400 which was flat. Most of the decline was attributable to a sell-off after its third quarter earnings. Though the company beat on revenue and earnings and delivered respectable 11% EPS year-on-year growth, the market disliked Heydude sales weakness and lowered 2025 guidance for revenue and operating margin. Though Heydude continues to disappoint, we believe performance could improve under a new brand president – Crocs’ former chief marketing officer and most recently president of Stanley cups where he reinvigorated the century-old drinkware brand. That said, our ownership of CROX does not hinge on a Heydude, but rather the Crocs brand which drives ~80% of sales. Crocs sales remain resilient in North America and continue to post strong momentum (double digit growth) in international markets where Crocs is underindexed compared to other footwear brands. One risk we are monitoring is prospective tariffs on imported footwear under the new administration. The company’s products are manufactured in China and Vietnam. In our view, Crocs is trading at an attractive valuation and we believe management, which has skin-in-the-game with share ownership, will buy back stock and continue open market purchases for themselves.
Portfolio Changes
The only new position added during the quarter was QXO. As it stands today QXO is a blank check company with around $5 billion in cash that is managed by serial entrepreneur Brad Jacobs (who has invested ~$900 million of his own capital into the business) and his hand-picked management team. Jacobs intends on applying his proven playbook of acquiring companies that operate in highly fragmented industries with large total addressable markets, integrating them under one umbrella, and infusing them with technology to optimize operations, drive growth, and deliver margin expansion. His focus this time around is the building materials distribution industry that is estimated to be worth around $800 billion. We agree with Jacobs’ assessment that these are attractive waters to fish in, as we’ve owned businesses that operate here in the past and followed others for years.
While there are many known unknowns with an investment like this, we think that the potential rewards outweigh the risks here because our team knows Jacobs and his team, and we have seen them execute well against their playbook numerous times. We were long-time investors in his last effort, XPO Logistics, and still own businesses spun off from that venture, RXO (truck brokerage) and GXO (warehouse logistics). We also appreciate the monetary alignment and idiosyncratic nature, which we believe offer benefits in a portfolio construction sense.
We trimmed two big winners that had grown into position sizes that we think introduced outsized risk. In the case of Goosehead, which rose 20% in the quarter, the company’s operating performance has been very good, but it is in a very similar business as (insurance brokerage) as another large holding, Brown & Brown. While this is an attractive market, we’re cognizant of over-exposing ourselves to a given industry or business. Similarly, Axon primarily sells into police forces funded by tax dollars, which is the same source of funding for our large holding in municipal software provider, Tyler Technologies. We have no qualms about Axon’s performance, and it is actively broadening its revenue sources by product, geography, and into the private sector. It’s breathtaking how well the company is performing and the investing public sees it and has bid shares up (they are up 130% in 2024). We think such high expectations now present valuation risk that we should respond to by owning a smaller position size, especially knowing Tyler shares similar revenue drivers.
The above information is intended solely for current clients of Motley Fool Wealth Management (“MFWM”) for the purpose of providing insight into how we manage our strategies and our investment philosophy. This information should not be disclosed to third parties or duplicated or used for any purpose other than the purpose for which it has been provided.
All information presented herein is for informational purposes only and should not be deemed as investment advice or a recommendation to purchase or sell any specific security. This information reflects the opinions, estimates and projections of MFWM as of the date of publication, which are subject to change without notice. We do not represent that any opinion, estimate or projection will be realized. While we believe this information to be reliable, no representation or warranty is made concerning its accuracy.
Performance results are based on a representative account for each strategy, not individual client accounts. Clients can see their actual account performance on the Interactive Brokers’ website at any time. Client account results may not exactly match the performance of the representative accounts. Such variance is due to a number of factors, including differences in trade prices, transaction fees, market activity, any restrictions have you may have imposed on your account(s), and the amount and the timing of deposits or withdrawals.
The performance information presented herein has been generated during a period of extraordinary market volatility. Accordingly, the performance is not necessarily indicative of results that we may achieve in the future, and we do not represent and it cannot be assumed that the performance of our strategies will be subject to the same economic risk factors that contributed to the above returns. Performance results discussed above represent past performance, which does not guarantee future results. The investment return and principal value of an investment will fluctuate so that current performance may be lower or higher than the performance discussed above. The investment strategy and focus of our model portfolio strategies can change over time. Similarly, there is no assurance that the securities purchased will remain in a model portfolio strategy or that securities sold may not be repurchased. The mention of specific holdings does not constitute a recommendation by MFWM or its affiliates.
To the extent we invest more heavily in particular sectors or industries of the economy, the performance of our strategies will be especially sensitive to developments that significantly affect those sectors or industries. While investing in a particular sector is not a principal investment strategy of any model portfolio, client portfolios may be significantly invested in a sector or industry as a result of our portfolio management decisions. Similarly, a model portfolio’s investment may become concentrated in a small number of issuers. To the extent that we take large positions in a small number of investments, account returns may fluctuate as a result of changes in the performance of such investments to a greater extent than that of a more diversified account. Returns realized by a client account may be adversely affected if a small number of these investments perform poorly.
Index performance is discussed for illustrative purposes only as a benchmark for each strategy’s performance, and does not predict or depict performance of that strategy. While index comparisons may be useful to provide a benchmark for a strategy’s performance, it must be noted that investments are not limited to the investments comprising the indices. Each of the strategy benchmark indices are unmanaged and cannot be purchased directly by investors. It is not possible to invest in an index.
This message is provided for informational purposes only, reflects our general views on investing and should not be relied upon as recommendations or financial planning advice. We encourage you to seek personalized advice from qualified professionals, including (without limitation) tax professionals, regarding all personal finance issues. While we can counsel on tax efficiency and general tax considerations, MFWM does not (and is not permitted to) provide tax or legal advice. Clients who need such advice should consult tax and legal professionals. This message may not be relied upon as personalized financial planning or tax advice.
MFWM is an SEC registered investment advisor with a fiduciary duty that requires it to act in the best interests of clients and to place the interests of clients before its own. HOWEVER, REGISTRATION AS AN INVESTMENT ADVISOR DOES NOT IMPLY ANY LEVEL OF SKILL OR TRAINING. Access to MFWM is only available to clients pursuant to an Investment Advisory Agreement and acceptance of our Client Relationship Summary and Brochure (Form ADV, Parts 2A and 2B). You are encouraged to read these documents carefully. All investments involve risk and may lose money. MFWM does not guarantee the results of any of its advice or account management. Clients should be aware that their individual account results may not exactly match the performance of any of our Model Portfolios. Past performance is no guarantee of future results. Each Personal Portfolio is subject to an account minimum, which varies based on the strategies included in the portfolio. MFWM retains the right to revise or modify portfolios and strategies if it believes such modifications would be in the best interests of its clients.
During discussions with our Wealth Advisors, they may provide advice with respect to 401(k) and IRA rollovers into accounts that are managed by MFWM. Such recommendations pose potential conflicts of interest in that rolling retirement savings into a MFWM managed account will generate ongoing asset-based fees for MFWM that it would not otherwise receive.
US Stock Markets
The US Stock Markets commentary includes the following holdings: US Large Cap Strategy (Vanguard S&P 500 ETF: VOO, US Mid Cap Strategy (Vanguard Mid-Cap ETF: VO), and US Small Cap Strategy (Vanguard Small-Cap ETF: VB)
U.S. Stock Markets were up around 2.5% on average for the quarter with the US Large Cap Strategy (“Large Cap”), which holds VOO, up about 2.4% net of ETF expenses, excluding account level fees and expenses, during the period. Mid-Caps underperformed the broad market and the Small Cap strategy this quarter. The Mid Cap Strategy (“Mid Cap”), which holds VO, gained just over 0.5%, net of ETF expenses, excluding account level fees and expenses, during the period. Small-Caps outpaced Mid-Caps, with the Small-Cap Strategy (“Small Cap”), which holds VB, up just under 1.7%, net of ETF expenses, excluding account level fees and expenses. In general, Large Cap equity performance was roughly in line with the broader market, with the Russell 1000 up about 2.7% in Q4. In a reversal from Q3, Technology and Communications stocks outpaced the broader market. Additional gains came from Consumer Cyclicals and Financial Services. Conversely, Basic Materials, Healthcare, and Real Estate were significant detractors during Q4. Value markedly underperformed Growth and the broad market during the quarter, as did higher dividend yielding stocks.
International Stock Markets
The International Stock Markets commentary includes the following holdings: International Developed Strategy (Vanguard FTSE Developed Markets ETF: VEA) and International Emerging Markets Strategy (Vanguard Emerging Markets ETF: VWO).
The Emerging Markets Strategy, which holds VWO, outperformed compared to the Developed Markets strategy, which holds VEA, losing roughly -5.7% and -8.1% net of ETF expenses, excluding account level fees and expenses, during Q4, respectively. The Developed Markets Strategy was hampered by weakness from Samsung and Nestle, offsetting stronger performance from application software giant SAP SE and automotive heavyweight Toyota. The Emerging Markets strategy performance was somewhat cushioned by Taiwan Semiconductor, China Construction Bank Corporation, and HDFC Bank Ltd. However, significant negative performance from retail giant Alibaba, restaurant services provider Meituan, oil and gas refiner Reliance, and media platforms and Tencent offset those gains.
US Real Estate
The US Real Estate commentary refers to Real Estate Investment Trusts Strategy (Vanguard REIT ETF; VNQ).
The Real Estate Strategy, which holds VNQ, also had a difficult fourth quarter. Losses were led by Industrial REIT Prologis, and real estate data provider CoStar Group. The Real Estate strategy delivered a performance of roughly -7.7%, net of ETF expenses, excluding account level fees and expenses, in Q4.
Fixed Income
The Fixed Income commentary refers to the following holdings: US Bonds Strategy (Vanguard Total Bond Market ETF: BND), Treasury Inflation-Protected Securities Strategy (Vanguard Short-Term Inflation-Protected Securities ETF: VTIP), and, for taxable accounts only, US Muni Bonds Strategy (iShares National Muni Bond ETF: MUB).
U.S. Bond markets were also negative in the quarter, with core bonds significantly lagging the U.S. Equity market. The US Bond Strategy, which holds BND, delivered a loss just shy of -3.1% for the quarter, net of ETF expenses, excluding account level fees and expenses. Long duration underperformed shorter- and intermediate-duration maturities during the quarter as the long-term interest rate outlook remains cautious. High Yield was a light in the broader US bond market during the period, while TIPS came in slightly behind the broader US bond market. The TIPS Strategy, which holds VTIP, posted a -0.1% loss, net of ETF expenses, excluding account level fees and expenses in Q4. The Municipal Bonds strategy, which holds MUB, was also down modestly, losing -0.9% , net of ETF expenses, excluding account level fees and expenses.
The above information is intended solely for current clients of Motley Fool Wealth Management ("MFWM") for the purpose of providing insight into how we manage our strategies and our investment philosophy. This information should not be disclosed to third parties or duplicated or used for any purpose other than the purpose for which it has been provided.
PLEASE NOTE that the performance results, presented for the passive strategies/index ETFs, do not represent the performance of MFWM’s discretionary management decisions, nor does it reflect the management fee charged by Fool Wealth to manage client accounts. Third party ETFs in which we invest client assets are subject to fees and expenses (“Underlying Fund Fees”) that are separate from (and in addition to) Fool Wealth’s management fee. These Underlying Fund Fees are passed along to clients. Depending on the strategy, Underlying Fund Fees may be significant. Fool Wealth’s management fees reduce the rate of return on investments. Details of Fool Wealth’s fees for index-based portfolios can be found in Item 5(A) (1)(a) of our Brochure (“Form ADV Part 2A”).
The exchange traded funds (“ETFs”) that Fool Wealth utilizes in our index-based portfolio program are managed by third party fund managers (such as Vanguard and BlackRock) unaffiliated with Fool Wealth, TMF or our affiliates. Third party ETF managers do not pay MFWM or our affiliates any transaction-based compensation (or any other type of fee or payment) in connection with the purchase of their ETFs by Fool Wealth clients. However, clients pay transaction fees (e.g., brokerage commissions) in connection with the purchase and sale of ETFs, and may pay to their custodian account fees and other miscellaneous charges.
The performance and other information included herein were calculated by third parties. While these third parties are reputable and we believe that the information is accurate, we have not independently verified the information.
All information presented herein is for informational purposes only and should not be deemed as investment advice or a recommendation to purchase or sell any specific security. This information reflects the opinions, estimates and projections of MFWM as of the date of publication, which are subject to change without notice. We do not represent that any opinion, estimate or projection will be realized. While we believe this information to be reliable, no representation or warranty is made concerning its accuracy.