Portfolio Manager Commentary Q2 '24
Contents
Large Cap Dividend
- The market was broadly impacted by uneven performance
- High interest rates and disdain towards value investing caused the strategy to suffer
- Top Q2 performer: Walmart (+12.92%)
- Bottom Q2 performer: Fastenal (-18.07%)
- Portfolio Activity: No positions were bought or sold
Portfolio Managers
Tony Arsta, CFAJeremy Myers, CFA
We said three months ago that the first quarter of the year looked very much like a continuation of the investing trends we had seen throughout 2023. The second quarter of 2024 was more of the same. As value investing remains out of favor and interest rates remain high, the Dividend strategy suffered a decline and underperformed the broader market. According to an assessment of the S&P 500, the Wall Street Journal said that in the second quarter, "companies related to the [artificial intelligence] theme gained 14.7%... whereas the rest lost 1.2%."1 This was led by chip designer Nvidia - which for a time became the largest company in the world, surpassing Apple and Microsoft.
The uneven performance of the market across the board extends beyond just the artificial intelligence names. There were very few winners in the markets during the quarter - a fact easy to miss as the market-cap weighted S&P 500 gained 4.3% in the quarter. In the same period, the S&P 500 Equal Weight Index - which as the name implies assigns an equal amount to each of the 500 companies - declined by 2.6%.2 Mid-cap and small-cap stocks also declined this quarter.
| QTD | YTD | 1Y | 3Y | 5Y | |
|---|---|---|---|---|---|
| US Large Cap Dividend | -3.04% | 0.72% | 6.29% | 0.92% | 7.56% |
| Benchmark (S&P 500) | 4.29% | 15.30% | 24.56% | 10.02% | 15.05% |
Across the board, investors seem largely to be in a holding pattern. Inflation and economic growth seem to be slowing, but not yet enough for the Federal Reserve Board to act on interest rates. Government policies are unpredictable ahead of election season. Thankfully our investment approach is not focused on beating the market in the next few months. Rather, we are looking for the best companies to hold over many years and many cycles - companies with a proven ability to generate cash flows on the behalf of their owners. We'll remain vigilantly focused on your investments within this strategy to reflect our philosophy that identifying and holding onto the highest quality businesses is a winning strategy.
Portfolio Review
Factoring in size and performance, the portfolio’s largest contributor, and largest detractor, were as follows:
- Walmart: 12.92% return, 6.61% average weight
- Fastenal: -18.07% return, 5.70% average weight
Bolstered by a value-seeking consumer and continued operational excellence, Walmart delivered another strong quarter for the Dividend portfolio. The company's ongoing share gains amongst affluent households have also been a tailwind for performance and investor sentiment. Management's strategy and execution in the realm of retail media, as well as their progress on operational and logistics improvements through leveraging AI have served to elevate profitability and seemingly lengthen their growth runway going forward. At the current valuation, shares deliver a historically low yield, but total shareholder return remains robust.
Industrial distributor Fastenal's first quarter earnings report classified the business environment as "weak but stable." That weakness continued as its interim announcements displayed softness below normal seasonal trends. Domestic manufacturing continues to be weak and has created a challenging environment. Fastenal remains focused on deepening relationships with core customers by signing on-site agreements (where it embeds a distribution branch on customer soil) and, in general, helping optimize critical supply chain functions for its customers. We believe the latter point should create sales opportunities for the company's salesforce that pay off in the long run. For now, Fastenal is admirably defending its profit margins as it continues to deal with a variety of operating headwinds.
Portfolio Changes
There were no changes to the portfolio this quarter.
1. "The Quarter That Split the Market, in Six Charts." Wall Street Journal, 30 June 2024
The above information is intended solely for current clients of Motley Fool Wealth Management (“MFWM”) for the purpose of providing insight into how we manage our strategies and our investment philosophy. This information should not be disclosed to third parties or duplicated or used for any purpose other than the purpose for which it has been provided.
All information presented herein is for informational purposes only and should not be deemed as investment advice or a recommendation to purchase or sell any specific security. This information reflects the opinions, estimates and projections of MFWM as of the date of publication, which are subject to change without notice. We do not represent that any opinion, estimate or projection will be realized. While we believe this information to be reliable, no representation or warranty is made concerning its accuracy.
Performance results are based on a representative account for each strategy, not individual client accounts. Clients can see their actual account performance on the Interactive Brokers’ website at any time. Client account results may not exactly match the performance of the representative accounts. Such variance is due to a number of factors, including differences in trade prices, transaction fees, market activity, any restrictions have you may have imposed on your account(s), and the amount and the timing of deposits or withdrawals.
The performance information presented herein has been generated during a period of extraordinary market volatility. Accordingly, the performance is not necessarily indicative of results that we may achieve in the future, and we do not represent and it cannot be assumed that the performance of our strategies will be subject to the same economic risk factors that contributed to the above returns. Performance results discussed above represent past performance, which does not guarantee future results. The investment return and principal value of an investment will fluctuate so that current performance may be lower or higher than the performance discussed above. The investment strategy and focus of our model portfolio strategies can change over time. Similarly, there is no assurance that the securities purchased will remain in a model portfolio strategy or that securities sold may not be repurchased. The mention of specific holdings does not constitute a recommendation by MFWM or its affiliates.
To the extent we invest more heavily in particular sectors or industries of the economy, the performance of our strategies will be especially sensitive to developments that significantly affect those sectors or industries. While investing in a particular sector is not a principal investment strategy of any model portfolio, client portfolios may be significantly invested in a sector or industry as a result of our portfolio management decisions. Similarly, a model portfolio’s investment may become concentrated in a small number of issuers. To the extent that we take large positions in a small number of investments, account returns may fluctuate as a result of changes in the performance of such investments to a greater extent than that of a more diversified account. Returns realized by a client account may be adversely affected if a small number of these investments perform poorly.
Index performance is discussed for illustrative purposes only as a benchmark for each strategy’s performance, and does not predict or depict performance of that strategy. While index comparisons may be useful to provide a benchmark for a strategy’s performance, it must be noted that investments are not limited to the investments comprising the indices. Each of the strategy benchmark indices are unmanaged and cannot be purchased directly by investors. It is not possible to invest in an index.
This message is provided for informational purposes only, reflects our general views on investing and should not be relied upon as recommendations or financial planning advice. We encourage you to seek personalized advice from qualified professionals, including (without limitation) tax professionals, regarding all personal finance issues. While we can counsel on tax efficiency and general tax considerations, MFWM does not (and is not permitted to) provide tax or legal advice. Clients who need such advice should consult tax and legal professionals. This message may not be relied upon as personalized financial planning or tax advice.
MFWM is an SEC registered investment advisor with a fiduciary duty that requires it to act in the best interests of clients and to place the interests of clients before its own. HOWEVER, REGISTRATION AS AN INVESTMENT ADVISOR DOES NOT IMPLY ANY LEVEL OF SKILL OR TRAINING. Access to MFWM is only available to clients pursuant to an Investment Advisory Agreement and acceptance of our Client Relationship Summary and Brochure (Form ADV, Parts 2A and 2B). You are encouraged to read these documents carefully. All investments involve risk and may lose money. MFWM does not guarantee the results of any of its advice or account management. Clients should be aware that their individual account results may not exactly match the performance of any of our Model Portfolios. Past performance is no guarantee of future results. Each Personal Portfolio is subject to an account minimum, which varies based on the strategies included in the portfolio. MFWM retains the right to revise or modify portfolios and strategies if it believes such modifications would be in the best interests of its clients.
During discussions with our Wealth Advisors, they may provide advice with respect to 401(k) and IRA rollovers into accounts that are managed by MFWM. Such recommendations pose potential conflicts of interest in that rolling retirement savings into a MFWM managed account will generate ongoing asset-based fees for MFWM that it would not otherwise receive.
Fixed Income
- Second quarter performance was much stronger than the first quarter, but trailing benchmark after fees
- 41% of the portfolio matures by the end of 2026
- Portfolio Activity: Added to the latter years of the ladder just before the quarter ended
Portfolio Managers
Tony Arsta, CFANate Weisshaar, CFA
June came and went with another delay in the Fed cutting its benchmark rate. Economic indicators suggest the US economy and inflation are slowing1, but not enough yet to spur the Fed into action.
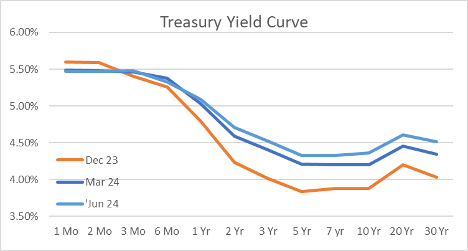
The Fed now expects to make one or two cuts to short-term interest rates by year-end, depending on how employment and inflation behave in the second half of the year. Interestingly, the Fed's expectation for the long-term "normal" short-term interest rate bumped up from 2.6% to 2.8%2 (still a long way from the current target range of 5.25%-5.5%).
This would suggest the central bank is expecting inflation to remain elevated relative to its 2% target inflation rate. Looking at the longer end of the yield curve (see chart below), it would seem the market shares the Fed's opinion on long-term inflation as the mid- to long-term rates have crept up during the second quarter.
There are several reasons inflation could prove sticky over the medium- to long-term including the energy transition away from fossil fuels, changes to the global supply chain, and restrictions on immigration. We are also likely to see government debt issuance (both in the US and internationally) increase as defense budgets increase and demographic shifts put pressure on entitlement programs, which raises questions about fiscal discipline.
Equity markets, with their excitement for AI-related stocks, would argue a different story - if AI is able to fulfill its promises, we should see a continuation of the historical march of falling production costs thanks to innovation.
For the Fixed Income SMA, the rise in longer-term rates was generally positive and the second quarter performance was much stronger than the first quarter (though still trailing the benchmark after fees).
Your portfolio remains skewed to the short-end of the curve - 41% of the portfolio matures by the end of 2026 - but your managers did add to the latter years of the ladder just before the quarter ended. As our 2024 rung is now six months away from liquidation, it gets hard to reinvest the debt that matures, so the ETF starts to hold cash.
While short-term rates make cash fairly attractive, we don't like paying management fees to have our money sitting in cash. So, we rolled ~60% of your 2024 rung into the 2026, 2030, 2031, and 2032 rungs. We chose to skip over the medium-term rungs because the yield on offer wasn't all that attractive in relative terms.
| QTD | YTD | 1Y | 3Y | 5Y | |
|---|---|---|---|---|---|
| Fixed Income | 0.57% | 0.69% | 3.93% | -1.04% | 0.11% |
| Bloomberg Barclays US Corporate Bond Index | 0.74% | 1.00% | 5.89% | -0.81% | 1.42% |
As we noted last quarter, your management team believes most of the dramatic rate increases are done for the time being, so we're comfortable modestly building our positions at the later rungs of the ladder (the 2030, 2031, and 2032 rungs now make up 22% of the total portfolio, up from 14% last quarter).
We continue to look to generate solid income without taking outsized risk. While the US economy continues to demonstrate strength, signs are that it is slowing. Were that to happen, rates would likely fall, but we could also see defaults increase. We have no interest in reaching for higher yield if it puts us at risk of taking losses to your principal. To paraphrase Warren Buffett, the best way to win is to avoid losses.
1. "Fed's Powell says US on 'disinflationary path,' but more data needed before rate cuts." Reuters, 2 July 2024 2. "Summary of Economic Projections" Federal Reserve, 12 June 2024
The above information is intended solely for current clients of Motley Fool Wealth Management (“MFWM”) for the purpose of providing insight into how we manage our strategies and our investment philosophy. This information should not be disclosed to third parties or duplicated or used for any purpose other than the purpose for which it has been provided.
All information presented herein is for informational purposes only and should not be deemed as investment advice or a recommendation to purchase or sell any specific security. This information reflects the opinions, estimates and projections of MFWM as of the date of publication, which are subject to change without notice. We do not represent that any opinion, estimate or projection will be realized. While we believe this information to be reliable, no representation or warranty is made concerning its accuracy.
Performance results are based on a representative account for each strategy, not individual client accounts. Clients can see their actual account performance on the Interactive Brokers’ website at any time. Client account results may not exactly match the performance of the representative accounts. Such variance is due to a number of factors, including differences in trade prices, transaction fees, market activity, any restrictions have you may have imposed on your account(s), and the amount and the timing of deposits or withdrawals.
The performance information presented herein has been generated during a period of extraordinary market volatility. Accordingly, the performance is not necessarily indicative of results that we may achieve in the future, and we do not represent and it cannot be assumed that the performance of our strategies will be subject to the same economic risk factors that contributed to the above returns. Performance results discussed above represent past performance, which does not guarantee future results. The investment return and principal value of an investment will fluctuate so that current performance may be lower or higher than the performance discussed above. The investment strategy and focus of our model portfolio strategies can change over time. Similarly, there is no assurance that the securities purchased will remain in a model portfolio strategy or that securities sold may not be repurchased. The mention of specific holdings does not constitute a recommendation by MFWM or its affiliates.
To the extent we invest more heavily in particular sectors or industries of the economy, the performance of our strategies will be especially sensitive to developments that significantly affect those sectors or industries. While investing in a particular sector is not a principal investment strategy of any model portfolio, client portfolios may be significantly invested in a sector or industry as a result of our portfolio management decisions. Similarly, a model portfolio’s investment may become concentrated in a small number of issuers. To the extent that we take large positions in a small number of investments, account returns may fluctuate as a result of changes in the performance of such investments to a greater extent than that of a more diversified account. Returns realized by a client account may be adversely affected if a small number of these investments perform poorly.
Index performance is discussed for illustrative purposes only as a benchmark for each strategy’s performance, and does not predict or depict performance of that strategy. While index comparisons may be useful to provide a benchmark for a strategy’s performance, it must be noted that investments are not limited to the investments comprising the indices. Each of the strategy benchmark indices are unmanaged and cannot be purchased directly by investors. It is not possible to invest in an index.
This message is provided for informational purposes only, reflects our general views on investing and should not be relied upon as recommendations or financial planning advice. We encourage you to seek personalized advice from qualified professionals, including (without limitation) tax professionals, regarding all personal finance issues. While we can counsel on tax efficiency and general tax considerations, MFWM does not (and is not permitted to) provide tax or legal advice. Clients who need such advice should consult tax and legal professionals. This message may not be relied upon as personalized financial planning or tax advice.
MFWM is an SEC registered investment advisor with a fiduciary duty that requires it to act in the best interests of clients and to place the interests of clients before its own. HOWEVER, REGISTRATION AS AN INVESTMENT ADVISOR DOES NOT IMPLY ANY LEVEL OF SKILL OR TRAINING. Access to MFWM is only available to clients pursuant to an Investment Advisory Agreement and acceptance of our Client Relationship Summary and Brochure (Form ADV, Parts 2A and 2B). You are encouraged to read these documents carefully. All investments involve risk and may lose money. MFWM does not guarantee the results of any of its advice or account management. Clients should be aware that their individual account results may not exactly match the performance of any of our Model Portfolios. Past performance is no guarantee of future results. Each Personal Portfolio is subject to an account minimum, which varies based on the strategies included in the portfolio. MFWM retains the right to revise or modify portfolios and strategies if it believes such modifications would be in the best interests of its clients.
During discussions with our Wealth Advisors, they may provide advice with respect to 401(k) and IRA rollovers into accounts that are managed by MFWM. Such recommendations pose potential conflicts of interest in that rolling retirement savings into a MFWM managed account will generate ongoing asset-based fees for MFWM that it would not otherwise receive.
International
- Muted results for international equity markets broadly
- Significant changes were made to the portfolio in Q2
- Top Q2 performer: Taiwan Semiconductor (+28.07%)
- Bottom Q2 performer: Porsche (-24.32%)
- Portfolio Activity: Bought London Stock Exchange Group; Sold Brookfield Corporation and Nestle; Added to Brookfield Asset Management, Kerry Group, Nintendo, Porsche, Symrise, Yum China Holdings; Trimmed Icon plc, Taiwan Semiconductor
Portfolio Managers
Tony Arsta, CFAMichael Olsen, CFA
As domestic markets scorched higher—even as they mulled the magnitude and timing of ever-elusive rate cuts and still-stubborn inflation—international markets marched to a somewhat different beat in the quarter past. Across much of Europe and abroad, markets contemplated the much more concrete realities: easing inflation and the very real possibility of rate cuts, mixed economic pictures amid stagnating growth in China and Germany, and somewhat unexpected election results in developed Europe and India. Equity markets responded in kind, with more muted results.
Against this backdrop, the International SMA declined -1.07% net of fees, while its benchmark returned 1.04%. Amid this period of relative uncertainty, your portfolio management team was particularly active: starting one new position, adding to six, selling two, and trimming two. As measured against our north star—to own the highest quality international businesses for long periods—we believe these decisions have meaningfully upgraded the portfolio. On surveying the portfolio’s composition and taking a long view of the underlying business’ prospects, we believe they are well-positioned to thrive in a range of macroeconomic environments.
Portfolio Contributors
A review of key contributors to the portfolio’s quarterly results follows. As we’ve written before, a portion of the International SMA remains invested in ETFs, to achieve geographic exposures: 11.89% on average, returning -1.14% on a weighted average basis.
On a weighted basis, giving effect to average weighting and absolute return, the portfolio’s largest contributor, and largest detractor, were as follows:
- Taiwan Semiconductor Company: 28.07% return; 5.00% weighting
- Porsche: -24.32% return; 3.29% weighting
Taiwan Semiconductor (TSMC) shares gained 27% in the quarter, and 70% year-to-date, outpacing the market and the semiconductor industry—on a combination of fundamental strength and AI ebullience, along with appreciation of its dominance in leading edge chip designs. The chipmaker’s revenues should increase 20% to 25% this year, and AI revenues will double. This should be a multi-year driver—with AI revenues expected to grow at a 50% annualized rate over the next five years, to more than 20% of revenue. But for the enthusiasm, we see potential for growth to surprise on the upside, as TSMC’s stranglehold on high-end chips contributes to high utilization, tight capacity, and price increases.
| QTD | YTD | 1Y | 3Y | 5Y | |
|---|---|---|---|---|---|
| International | -1.07% | 4.12% | 11.87% | 0.04% | 6.75% |
| S&P Global ex-U.S. | 1.04% | 5.52% | 12.10% | 0.46% | 6.06% |
But while TSMC’s fundamental outlook has improved, we’ve trimmed our position as these shares have run higher for portfolio management reasons. We remain cognizant of geopolitical risks: a mere 100 miles of sea separate Taiwan from China. Equally, while it’s impossible to foresee how AI will change the world, and TSMC’s fundamental outlook has undoubtedly benefited, the market appears to have taken a very enthusiastic view of its impact on TSMC. For this reason, we took some profits, but retain a well sized position.
Iconic sport car-maker Porsche’s shares declined -24.32% in the quarter. At issue were a trio of concerns: reduced 2024 guidance, concerns over a weakening macro, and the possibility of Euro/China trade tensions culminating in tariffs on German auto exports. On the first matter, 2024 guidance, we believe these represent a near-term issue—Porsche will incur elevated costs as it refreshes a wide swathe of its vehicle line-up in 2024, which will drag on near-term earnings but provide grist for mid-term pricing. On macro matters, we take a longer view: we believe Porsche shares trade at an undemanding valuation, it possesses one of the world’s most cherished brands, and compelling long-term growth prospects on unit count and pricing power. As related to tariffs, we believe the market’s more than discounted the prospective downside from Chinese tariffs and according sales declines as shares trade near 15 times our estimate of free cash flow. Equally, given a mid-term view, we expect Porsche can divert lost sales to other geographic regions as it did throughout 2023. At current prices, we believe Porsche shares represent compelling value.
Portfolio Activity
As mentioned above, it was a particularly active quarter for us. A summary of the quarter’s portfolio activity follows.
New Buy
London Stock Exchange Group: We started a position in London Stock Exchange Group, which got its start operating, you guessed it, the London Stock Exchange. The 2021 acquisition of Refinitiv (formerly known as Thompson Reuters), a leading provider of financial market data, dramatically changed its business. This combination creates one of the largest financial market infrastructure and data providers in the world—they operate the pipes of some of the largest equity, debt, and FX markets in the world—transmitting mission-critical data to financial services providers.
As one of the world’s leading providers of financial data—indices, market pricing, clearing data, and so on—LSE Group’s underlying enterprise has a measure of embedded growth, because it's indexed to global financial markets. With the acquisition of Refinitiv, our hypothesis is that its data sets have become more valuable, as it is (theoretically, at least) able to offer its customers integrated data sets. We expect the business to generate reliable and recurring growth, making them good value at current prices.
Additions to Existing Positions
Brookfield Asset Management: We traded our position in Brookfield Corporation for one of its sister companies—of which it holds majority ownership—Brookfield Asset Management, one of the country’s largest alternative asset managers. Two factors underlie this decision. First, we believe the economics of a well-run alternative asset manager are exceptional, characterized by recurring cash flows, durable growth, and high cash profitability. Second, the asset management business is far more transparent and compelling to us than the more opaque, though historically profitable, operations of the recently separated Brookfield Corporation. Equally significant, we believe the largest and most scaled alternative asset managers are likely to take share from smaller peers—as they capitalize on brand advantages, global scale and distribution, and access to deal flow. As one of the largest alt managers, we believe this positions Brookfield Asset Management favorably.
Kerry Group: We increased our position in ingredients and flavor solutions purveyor, Kerry Group. We believe that the past few years’ headwinds, characterized by uncertainty over the consumer’s health and destocking, are poised to turn in the coming year. Equally important, we think Kerry’s business, and portfolio of products, is well-positioned to deliver durable across-the-cycle cash generation, irrespective of the economy’s state. In our view, Kerry appears suited to deliver above-market growth for a sustained window: it is one of the few ingredients/flavors companies that offers a fully-integrated solution, helping clients build an entire taste profile for a specific product. As Kerry shares trade near 20 times our estimate of this year’s free cash flow, we believe they represent attractive value.
Nintendo: We are adding to our position Nintendo—ahead of the pending announcement of the incredibly successful Switch console’s successor, expected by March 2025. A new console is likely to be accompanied by more advanced processing capacity, opening the possibility to license AAA titles and third-party games to the Switch platform, and a strong lineup of first party titles to support new console adoption. Altogether, these should contribute to strong software sales for the first few years and contribute a long tail of semi-recurring, high-margin revenues for a sustained period. Notably, and to this point, the company continues to reduce its reliance on traditional hardware sales, and continues to explore alternative means of capitalizing on its IP library. Taking a broader view of Nintendo and its prospects, we believe the company represents one of the best-managed international content companies—with a deep content library of iconic characters, a strong corporate culture, and strong optionality with respect to how it monetizes said content.
Porsche: We increased our position in the iconic sports car maker. Taking a long view of our Porsche investment, we believe the company’s franchise stands apart. As one of the world’s preeminent sportscar manufacturers, with a brand and engineering excellence to match—but only 0.5% share of the global auto market—we believe Porsche can grow cash flow at high-single digit rates for much longer than conventional wisdom appreciates via a combination of pricing action on new models/BEV, increasing premiumization of its existing fleet, unit growth, and modest margin expansion. As shares trade near 20 times our estimate of 2024 free cash flow, we believe they represent compelling value.
Symrise: We’re adding to our position in flavors and fragrances giant, Symrise, increasing our position to 3% of the International SMA. On account of its product mix and market selection—geared to pet food, smaller CPG companies, and cosmetic ingredients—we continue to believe Symrise remains well-positioned to deliver sustained, best-in-class growth relative to its consumer products/flavors and fragrances peers. Equally, we believe that headwinds of the year past, destocking amid concerns over consumer health and a plant shutdown, should become tailwinds in the coming year. More broadly, we believe the market hasn’t properly rewarded Symrise’s merits of strong competitive position, advantageous market selection, and intelligent moves into adjacent categories for their ability to deliver higher-than-expected growth for sustained periods.
Yum China Holdings: We are adding to Yum China (YUMC), China’s largest restaurant operator with ~15,000 stores, increasing our position to 2.5% of the International SMA. We think YUMC remains one of the highest quality Chinese consumer companies, and the market has allowed an opportunity as a result of negativity on all things China. The company’s tracking to open 1,500-1,700 new stores this year, and appears well-positioned to deliver on its medium-term target of 20,000 stores by 2026. This should support growth, even if same-store sales flag. During a difficult period, management’s proven able to maintain good restaurant margin through operating efficiency. Unit economics at KFC and Pizza Hut remain attractive with 2-3 year paybacks, and we are optimistic on new smaller formats that will help the company penetrate lower tier cities. Management has telegraphed intentions to return $1.5 billion in buybacks and dividends this year, part of a plan to return $3 billion to shareholders by 2026—against a $15 billion market cap.
Sales/trims
Brookfield Corporation: As above, we’re trading our position in infrastructure investment giant, Brookfield Corporation, for a position in its sister corporation—Brookfield Asset Management.
ICON plc: We reduced our position in ICON plc. This isn’t a commentary on our keenness regarding ICON’s prospects, the shares’ valuation, or recent performance. We believe shares are attractively valued, management has executed to a high standard, the business is humming, and its prospects remain bright. Instead, we trimmed for portfolio management reasons: the shares have performed quite well over the past year, and the position had become too large for our comfort. Even so, we remain enthusiastic owners.
Nestle: We sold our position in consumer products giant Nestle. In short, we think Nestle continues to be a capably managed business and stalwart within its respective realms, but we believe Symrise and Kerry represent more attractive means of acquiring CPG exposure, at better valuations.
Taiwan Semiconductor Manufacturing: We trimmed our position in Taiwan Semiconductor. Here, again, this says less about our enthusiasm regarding TSMC’s prospects—we expect it to benefit from AI tailwinds, increasing digitization of organizations, and growing demand for cloud-based applications. Instead this, again, is a portfolio management decision. Shares of TSMC have performed quite well. For this reason, we took some profits, but maintain a fairly-sized position in the world’s largest chipmaker.
The above information is intended solely for current clients of Motley Fool Wealth Management (“MFWM”) for the purpose of providing insight into how we manage our strategies and our investment philosophy. This information should not be disclosed to third parties or duplicated or used for any purpose other than the purpose for which it has been provided.
All information presented herein is for informational purposes only and should not be deemed as investment advice or a recommendation to purchase or sell any specific security. This information reflects the opinions, estimates and projections of MFWM as of the date of publication, which are subject to change without notice. We do not represent that any opinion, estimate or projection will be realized. While we believe this information to be reliable, no representation or warranty is made concerning its accuracy.
Performance results are based on a representative account for each strategy, not individual client accounts. Clients can see their actual account performance on the Interactive Brokers’ website at any time. Client account results may not exactly match the performance of the representative accounts. Such variance is due to a number of factors, including differences in trade prices, transaction fees, market activity, any restrictions have you may have imposed on your account(s), and the amount and the timing of deposits or withdrawals.
The performance information presented herein has been generated during a period of extraordinary market volatility. Accordingly, the performance is not necessarily indicative of results that we may achieve in the future, and we do not represent and it cannot be assumed that the performance of our strategies will be subject to the same economic risk factors that contributed to the above returns. Performance results discussed above represent past performance, which does not guarantee future results. The investment return and principal value of an investment will fluctuate so that current performance may be lower or higher than the performance discussed above. The investment strategy and focus of our model portfolio strategies can change over time. Similarly, there is no assurance that the securities purchased will remain in a model portfolio strategy or that securities sold may not be repurchased. The mention of specific holdings does not constitute a recommendation by MFWM or its affiliates.
To the extent we invest more heavily in particular sectors or industries of the economy, the performance of our strategies will be especially sensitive to developments that significantly affect those sectors or industries. While investing in a particular sector is not a principal investment strategy of any model portfolio, client portfolios may be significantly invested in a sector or industry as a result of our portfolio management decisions. Similarly, a model portfolio’s investment may become concentrated in a small number of issuers. To the extent that we take large positions in a small number of investments, account returns may fluctuate as a result of changes in the performance of such investments to a greater extent than that of a more diversified account. Returns realized by a client account may be adversely affected if a small number of these investments perform poorly.
Index performance is discussed for illustrative purposes only as a benchmark for each strategy’s performance, and does not predict or depict performance of that strategy. While index comparisons may be useful to provide a benchmark for a strategy’s performance, it must be noted that investments are not limited to the investments comprising the indices. Each of the strategy benchmark indices are unmanaged and cannot be purchased directly by investors. It is not possible to invest in an index.
This message is provided for informational purposes only, reflects our general views on investing and should not be relied upon as recommendations or financial planning advice. We encourage you to seek personalized advice from qualified professionals, including (without limitation) tax professionals, regarding all personal finance issues. While we can counsel on tax efficiency and general tax considerations, MFWM does not (and is not permitted to) provide tax or legal advice. Clients who need such advice should consult tax and legal professionals. This message may not be relied upon as personalized financial planning or tax advice.
MFWM is an SEC registered investment advisor with a fiduciary duty that requires it to act in the best interests of clients and to place the interests of clients before its own. HOWEVER, REGISTRATION AS AN INVESTMENT ADVISOR DOES NOT IMPLY ANY LEVEL OF SKILL OR TRAINING. Access to MFWM is only available to clients pursuant to an Investment Advisory Agreement and acceptance of our Client Relationship Summary and Brochure (Form ADV, Parts 2A and 2B). You are encouraged to read these documents carefully. All investments involve risk and may lose money. MFWM does not guarantee the results of any of its advice or account management. Clients should be aware that their individual account results may not exactly match the performance of any of our Model Portfolios. Past performance is no guarantee of future results. Each Personal Portfolio is subject to an account minimum, which varies based on the strategies included in the portfolio. MFWM retains the right to revise or modify portfolios and strategies if it believes such modifications would be in the best interests of its clients.
During discussions with our Wealth Advisors, they may provide advice with respect to 401(k) and IRA rollovers into accounts that are managed by MFWM. Such recommendations pose potential conflicts of interest in that rolling retirement savings into a MFWM managed account will generate ongoing asset-based fees for MFWM that it would not otherwise receive.
Large Cap Core
- 2023 investing trends continue apace
- Investors in a holding pattern awaiting Fed action
- Top Q2 performer: Alphabet (+20.6%)
- Bottom Q2 performer: CoStar Group (-23.24%)
- Portfolio Activity: Increased investment in UPS
Portfolio Managers
Tony Arsta, CFAJeremy Myers, CFA
We said three months ago that the first quarter of the year looked very much like a continuation of the investing trends we had seen throughout 2023. The second quarter of 2024 was more of the same. While we delivered positive returns for your portfolio, we trailed our benchmark for this strategy, the S&P 500. According to an assessment of the S&P 500, the Wall Street Journal said that in the second quarter, "companies related to the [artificial intelligence] theme gained 14.7%... whereas the rest lost 1.2%."1 This was led by chip designer Nvidia - which for a time became the largest company in the world, surpassing Apple and Microsoft.
The uneven performance of the market across the board extends beyond just the artificial intelligence names. There were very few winners in the markets during the quarter - a fact easy to miss as the market-cap weighted S&P 500 gained 4.3% in the quarter. In the same period, the S&P 500 Equal Weight Index - which as the name implies assigns an equal amount to each of the 500 companies - declined by 2.6%. Mid-cap and small-cap stocks also declined this quarter.
Across the board, investors seem largely to be in a holding pattern. Inflation, and economic growth, seem to be slowing but not yet enough for the Federal Reserve Board to act on interest rates. Government policies are unpredictable ahead of election season. Thankfully our investment approach is not focused on beating the market in the next few months. Rather, we are looking for the best companies to hold over many years and many cycles - companies with a proven ability to generate cash flows on the behalf of their owners. We'll remain vigilantly focused on your investments within this strategy to reflect our philosophy that identifying and holding onto the highest quality businesses is a winning strategy.
Portfolio Review
Factoring in size and performance, the portfolio’s largest contributor, and largest detractor, were as follows:
- Alphabet: 20.60% return, 6.39% average weight
- CoStar Group: -23.25% return, 2.01% average weight
Alphabet was the top performer for the quarter thanks to the AI theme. Despite being a leading tech company that was willing to spend liberally on initiatives such as AI research in its "Other Bets" segment, the stock hadn't quite been keeping up with its "Magnificent Seven" peers in recent months. There had been concerns that the company was losing ground in its core search business, and that its Google Cloud segment couldn't keep up with competitors. But this past quarter, the market decided to give them some credit. Alphabet's quarterly earnings release in late April confirmed that the company had not in fact lost its dominant positioning overnight. Rather than destroying its business, Google is making successful progress with its own AI development, which may prove to be a benefit to its advertising revenue potential. And the sky did not fall on Google Cloud either. All this led to renewed investor optimism, sending the shares higher by 20.6% throughout the quarter.
CoStar Group continues to be unloved by the market. The company is a data provider to the commercial real estate industry, which continues to suffer through office vacancies and high interest rates. Meanwhile, CoStar keeps executing on its long-term vision, waiting for an eventual turn in the market cycle. The business is continuing to grow since data and analytics is only becoming more important. And while their site Homes.com is not yet the leading destination to search for properties, it is growing quickly and becoming a more important part of the business. Given its proven track record building go-to sources of real estate data, we continue to like this business for the long run.
Portfolio Changes
We increased our investment in United Parcel Service during the quarter. UPS has recently struggled thanks to disappointing package volume and a new labor contract that will likely depress margins in the near term. The good news is that for the first time the contract allows for a significant upgrade to automation equipment within the distribution facilities. The recent slowdown has also given management cover to cut more costs by consolidating facilities and cutting headcount. We think these moves will set the company up for better-than-expected profitability when this cyclical business eventually picks back up.
| QTD | YTD | 1Y | 3Y | 5Y | 10Y | |
|---|---|---|---|---|---|---|
| US Large Cap Core | 0.88% | 10.09% | 24.15% | 5.42% | 13.06% | 13.16% |
| Benchmark (S&P 500) | 4.29% | 15.30% | 24.56% | 10.02% | 15.05% | 12.87% |
1. "The Quarter That Split the Market, in Six Charts." Wall Street Journal, 30 June 2024
The above information is intended solely for current clients of Motley Fool Wealth Management (“MFWM”) for the purpose of providing insight into how we manage our strategies and our investment philosophy. This information should not be disclosed to third parties or duplicated or used for any purpose other than the purpose for which it has been provided.
All information presented herein is for informational purposes only and should not be deemed as investment advice or a recommendation to purchase or sell any specific security. This information reflects the opinions, estimates and projections of MFWM as of the date of publication, which are subject to change without notice. We do not represent that any opinion, estimate or projection will be realized. While we believe this information to be reliable, no representation or warranty is made concerning its accuracy.
Performance results are based on a representative account for each strategy, not individual client accounts. Clients can see their actual account performance on the Interactive Brokers’ website at any time. Client account results may not exactly match the performance of the representative accounts. Such variance is due to a number of factors, including differences in trade prices, transaction fees, market activity, any restrictions have you may have imposed on your account(s), and the amount and the timing of deposits or withdrawals.
The performance information presented herein has been generated during a period of extraordinary market volatility. Accordingly, the performance is not necessarily indicative of results that we may achieve in the future, and we do not represent and it cannot be assumed that the performance of our strategies will be subject to the same economic risk factors that contributed to the above returns. Performance results discussed above represent past performance, which does not guarantee future results. The investment return and principal value of an investment will fluctuate so that current performance may be lower or higher than the performance discussed above. The investment strategy and focus of our model portfolio strategies can change over time. Similarly, there is no assurance that the securities purchased will remain in a model portfolio strategy or that securities sold may not be repurchased. The mention of specific holdings does not constitute a recommendation by MFWM or its affiliates.
To the extent we invest more heavily in particular sectors or industries of the economy, the performance of our strategies will be especially sensitive to developments that significantly affect those sectors or industries. While investing in a particular sector is not a principal investment strategy of any model portfolio, client portfolios may be significantly invested in a sector or industry as a result of our portfolio management decisions. Similarly, a model portfolio’s investment may become concentrated in a small number of issuers. To the extent that we take large positions in a small number of investments, account returns may fluctuate as a result of changes in the performance of such investments to a greater extent than that of a more diversified account. Returns realized by a client account may be adversely affected if a small number of these investments perform poorly.
Index performance is discussed for illustrative purposes only as a benchmark for each strategy’s performance, and does not predict or depict performance of that strategy. While index comparisons may be useful to provide a benchmark for a strategy’s performance, it must be noted that investments are not limited to the investments comprising the indices. Each of the strategy benchmark indices are unmanaged and cannot be purchased directly by investors. It is not possible to invest in an index.
This message is provided for informational purposes only, reflects our general views on investing and should not be relied upon as recommendations or financial planning advice. We encourage you to seek personalized advice from qualified professionals, including (without limitation) tax professionals, regarding all personal finance issues. While we can counsel on tax efficiency and general tax considerations, MFWM does not (and is not permitted to) provide tax or legal advice. Clients who need such advice should consult tax and legal professionals. This message may not be relied upon as personalized financial planning or tax advice.
MFWM is an SEC registered investment advisor with a fiduciary duty that requires it to act in the best interests of clients and to place the interests of clients before its own. HOWEVER, REGISTRATION AS AN INVESTMENT ADVISOR DOES NOT IMPLY ANY LEVEL OF SKILL OR TRAINING. Access to MFWM is only available to clients pursuant to an Investment Advisory Agreement and acceptance of our Client Relationship Summary and Brochure (Form ADV, Parts 2A and 2B). You are encouraged to read these documents carefully. All investments involve risk and may lose money. MFWM does not guarantee the results of any of its advice or account management. Clients should be aware that their individual account results may not exactly match the performance of any of our Model Portfolios. Past performance is no guarantee of future results. Each Personal Portfolio is subject to an account minimum, which varies based on the strategies included in the portfolio. MFWM retains the right to revise or modify portfolios and strategies if it believes such modifications would be in the best interests of its clients.
During discussions with our Wealth Advisors, they may provide advice with respect to 401(k) and IRA rollovers into accounts that are managed by MFWM. Such recommendations pose potential conflicts of interest in that rolling retirement savings into a MFWM managed account will generate ongoing asset-based fees for MFWM that it would not otherwise receive.
Hedged Equity
- Hedge Equity lagged its benchmark, but semtiment towards the future of the strategy remains positive
- Significant changes were made to the portfolio in Q2
- Top Q2 performer: Alphabet (+20.60%)
- Bottom Q2 performer: Invesco QQQ Trust ETF (-8.08%)
- Portfolio Activity: Bought Nintendo and Porsche; Sold Starbucks; Added to Rentokil; Trimmed Meta Platforms, Watsco, and Icon
Portfolio Managers
JP Bennett, CFAMichael Olsen, CFA
Stop us if you've heard this before: Stocks continue to gain ground, but the winning isn't spread evenly.
The US, as measured by the S&P 500, advanced about 4% in the second quarter while international stocks were roughly flat. Inside the US, the largest caps led the way, advancing nicely while small and mid caps (as measured by the S&P Small Cap 600 and S&P Mid Cap 400 Index) declined more than -3% each. Even the equal weight S&P 500 declined. In other words,the largest US companies continue to be the Belle of the Ball while everything else seems to be suffering from some combination of silly haircuts, bad breath, and awkward dancing.
The US Economy continues to be resilient, though uneven and moderating. Despite inflation looking under control, the economic data has supported a patient Fed. Abroad, we've seen several central banks begin moving to a more neutral monetary policy and current expectations are for a single cut this year in the US.
Interest in AI-related stocks, momentum, and size were the key to great performance. The most cyclical sectors struggled (apparently nobody told markets that semiconductors, up more than 20%, are cyclical), which also meant value lagged growth.
Our Hedged Equity strategy's performance trailed its benchmark. Six of our ten largest holdings declined in value and only two outperformed our benchmark. While this result is disappointing, we take heart in our belief that all ten of our top holdings produced strong operating results that we believe contributed to intrinsic value growth. It strikes us that this was a quarter where these stock price moves were noise more than signal. Further, a lack of exposure to "what is working" continues to weigh on results. Ultimately, we believe our patience and commitment to our collection of resilient businesses will be rewarded.
Portfolio Review
Factoring in size and performance, the portfolio’s largest contributor, and largest detractor, were as follows:
- Alphabet: 20.60% return, 5.84% average weight
- Invesco QQQ Trust ETF: 8.08% return, -8.92% average weight (short position)
Alphabet was the top performer for the quarter. Despite being a leading tech company that was willing to spend liberally on initiatives such as AI research in its "Other Bets" segment, the stock hadn't quite been keeping up with its "Magnificent Seven" peers in recent months. But this past quarter, the market decided to give them some credit. There had been concerns that the company was losing ground in its core search business, and that its Google Cloud segment couldn't keep up with competitors. Alphabet's quarterly earnings release in late April confirmed that the company had not in fact lost its dominant positioning overnight. Rather than destroying its business, Google is making successful progress with its own AI development, which may prove to be a benefit to its advertising revenue potential. And the sky did not fall on Google Cloud either. All this led to renewed investor optimism, sending the shares higher by 20.6% throughout the quarter.
The Invesco QQQ Trust ETF, which we are short, continues to march higher, rising nearly 9% during the quarter. This position has served as a hedge given our communications services and higher beta (more volatile) positions. However, the top-heavy nature of the ETF and its exposure to AI beneficiaries has been a tailwind and hurt the relative returns of your strategy. This ETF also correlates strongly with market momentum, which makes it painful on the way up but effective on the way down. For now, we are staying the course as it helps us achieve a target net exposure.
Portfolio Changes
In May, we made some changes to the portfolio. We sold long-time holding Starbucks, the ubiquitous global coffee giant, as our confidence has fallen that the current CEO has the vision and support to turn around the company's traffic problem. In our view, the proposed plan fails to address the root issues plaguing the company. We're moving on. We also trimmed some recent winners, Meta Platforms, Watsco, and Icon to fund new positions that look particularly attractive.
In addition to adding to pest control turnaround Rentokil, we initiated positions in Nintendo and Porsche.
Nintendo is a Japanese global powerhouse in gaming and entertainment. Our thesis is predicated on the belief that Nintendo's business has evolved away from the cyclical boom-bust nature of consoles and hits into a sustainable one where (i) Nintendo operates a gaming platform anchored by its world-class first-party games and a positive feedback loop where a large install base attracts third-party developers, (ii) engages more digitally through online items and digital distribution of game software, (iii) the company builds direct relationships with gamers through Nintendo Account and its online subscription model NSO, and (iv) the company leverages its intellectual property and becomes more of an entertainment company with a connected universe outside of video games. The upshot, in our view, is more durable growth, higher margins and stronger cash flow. We are starting a position in Nintendo ahead of the pending announcement of the incredibly successful Switch console's successor, expected by March 2025. Taking a broader view of Nintendo and its prospects, we believe the company represents one of the best-managed global content companies-with a deep content library of iconic characters, a strong corporate culture, and strong optionality with respect to how it monetizes said content.
We also initiated a position in iconic sports car maker, Porsche. In short, we believe that near-term concerns-of China-driven sales weakness and lower margins on new model releases/EV rollouts-create a very attractive opportunity for long-term investors. Specific to the issues at hand, we believe that in the mid-term, any China-related softness should be offset by higher-end models, and efforts to redirect product. As proof, we'd note that despite an almost -20% decline in 2023 China sales, company-wide sales increased almost 8% on favorable mix/pricing action and strength in regions outside of China. On the matter of EVs and new vehicle rollouts, we'd note that Porsche will incur higher costs and lower margins in 2024, as it refreshes a number of vehicles. Long-term, we believe this represents a single-year anomaly. Equally important, we believe the just-released Macan BEV should deliver gross margins approximating the company-wide average-alleviating a key source of worry among investors. As one of the world's preeminent sportscar manufacturers, with a brand and engineering excellence to match-but only 0.5% share of the global auto market-we believe Porsche can grow cash flow at high-single digit rates for much longer than conventional wisdom appreciates via a combination of pricing action on new models/BEV, increasing premiumization of its existing fleet, unit growth, and modest margin expansion.
| QTD | YTD | 1Y | 3Y | 5Y | 10Y | |
|---|---|---|---|---|---|---|
| Hedged Equity | -1.77% | 2.22% | 14.10% | -2.71% | 5.51% | 7.64% |
| Benchmark (70% of S&P 500) | 3.04% | 10.59% | 16.90% | 7.27% | 10.71% | 9.12% |
The above information is intended solely for current clients of Motley Fool Wealth Management (“MFWM”) for the purpose of providing insight into how we manage our strategies and our investment philosophy. This information should not be disclosed to third parties or duplicated or used for any purpose other than the purpose for which it has been provided.
All information presented herein is for informational purposes only and should not be deemed as investment advice or a recommendation to purchase or sell any specific security. This information reflects the opinions, estimates and projections of MFWM as of the date of publication, which are subject to change without notice. We do not represent that any opinion, estimate or projection will be realized. While we believe this information to be reliable, no representation or warranty is made concerning its accuracy.
Performance results are based on a representative account for each strategy, not individual client accounts. Clients can see their actual account performance on the Interactive Brokers’ website at any time. Client account results may not exactly match the performance of the representative accounts. Such variance is due to a number of factors, including differences in trade prices, transaction fees, market activity, any restrictions have you may have imposed on your account(s), and the amount and the timing of deposits or withdrawals.
The performance information presented herein has been generated during a period of extraordinary market volatility. Accordingly, the performance is not necessarily indicative of results that we may achieve in the future, and we do not represent and it cannot be assumed that the performance of our strategies will be subject to the same economic risk factors that contributed to the above returns. Performance results discussed above represent past performance, which does not guarantee future results. The investment return and principal value of an investment will fluctuate so that current performance may be lower or higher than the performance discussed above. The investment strategy and focus of our model portfolio strategies can change over time. Similarly, there is no assurance that the securities purchased will remain in a model portfolio strategy or that securities sold may not be repurchased. The mention of specific holdings does not constitute a recommendation by MFWM or its affiliates.
To the extent we invest more heavily in particular sectors or industries of the economy, the performance of our strategies will be especially sensitive to developments that significantly affect those sectors or industries. While investing in a particular sector is not a principal investment strategy of any model portfolio, client portfolios may be significantly invested in a sector or industry as a result of our portfolio management decisions. Similarly, a model portfolio’s investment may become concentrated in a small number of issuers. To the extent that we take large positions in a small number of investments, account returns may fluctuate as a result of changes in the performance of such investments to a greater extent than that of a more diversified account. Returns realized by a client account may be adversely affected if a small number of these investments perform poorly.
Index performance is discussed for illustrative purposes only as a benchmark for each strategy’s performance, and does not predict or depict performance of that strategy. While index comparisons may be useful to provide a benchmark for a strategy’s performance, it must be noted that investments are not limited to the investments comprising the indices. Each of the strategy benchmark indices are unmanaged and cannot be purchased directly by investors. It is not possible to invest in an index.
This message is provided for informational purposes only, reflects our general views on investing and should not be relied upon as recommendations or financial planning advice. We encourage you to seek personalized advice from qualified professionals, including (without limitation) tax professionals, regarding all personal finance issues. While we can counsel on tax efficiency and general tax considerations, MFWM does not (and is not permitted to) provide tax or legal advice. Clients who need such advice should consult tax and legal professionals. This message may not be relied upon as personalized financial planning or tax advice.
MFWM is an SEC registered investment advisor with a fiduciary duty that requires it to act in the best interests of clients and to place the interests of clients before its own. HOWEVER, REGISTRATION AS AN INVESTMENT ADVISOR DOES NOT IMPLY ANY LEVEL OF SKILL OR TRAINING. Access to MFWM is only available to clients pursuant to an Investment Advisory Agreement and acceptance of our Client Relationship Summary and Brochure (Form ADV, Parts 2A and 2B). You are encouraged to read these documents carefully. All investments involve risk and may lose money. MFWM does not guarantee the results of any of its advice or account management. Clients should be aware that their individual account results may not exactly match the performance of any of our Model Portfolios. Past performance is no guarantee of future results. Each Personal Portfolio is subject to an account minimum, which varies based on the strategies included in the portfolio. MFWM retains the right to revise or modify portfolios and strategies if it believes such modifications would be in the best interests of its clients.
During discussions with our Wealth Advisors, they may provide advice with respect to 401(k) and IRA rollovers into accounts that are managed by MFWM. Such recommendations pose potential conflicts of interest in that rolling retirement savings into a MFWM managed account will generate ongoing asset-based fees for MFWM that it would not otherwise receive.
Large Cap Aggressive Growth
- Portfolio outlook remains the same from Q1
- NVIDIA lifted AI stocks to outperform the remainder of the market
- Top Q2 performer: Palo Alto Networks (+19.32%)
- Bottom Q2 performer: Salesforce (-14.64%)
- Portfolio Activity: Bought Dexcom
Portfolio Managers
Tony Arsta, CFAJeremy Myers, CFA
We said three months ago that the first quarter of the year looked very much like a continuation of the investing trends we had seen throughout 2023. The second quarter of 2024 was more of the same. While we delivered positive returns for your portfolio, we trailed our benchmark for this strategy, the S&P 500. According to an assessment of the S&P 500, the Wall Street Journal said that in the second quarter, "companies related to the [artificial intelligence] theme gained 14.7%... whereas the rest lost 1.2%."1 This was led by chip designer Nvidia - which for a time became the largest company in the world, surpassing Apple and Microsoft.
The uneven performance of the market across the board extends beyond just the artificial intelligence names. There were very few winners in the markets during the quarter - a fact easy to miss as the market-cap weighted S&P 500 gained 4.3% in the quarter. In the same period, the S&P 500 Equal Weight Index - which as the name implies assigns an equal amount to each of the 500 companies - declined by 2.6%.2 Mid-cap and small-cap stocks also declined this quarter.
Across the board, investors seem largely to be in a holding pattern. Inflation and economic growth seem to be slowing but not yet enough for the Federal Reserve Board to act on interest rates. Government policies are unpredictable ahead of election season. Thankfully our investment approach is not focused on beating the market in the next few months. Rather, we are looking for the best companies to hold over many years and many cycles - companies with a proven ability to generate cash flows on the behalf of their owners. We'll remain vigilantly focused on your investments within this strategy to reflect our philosophy that identifying and holding onto the highest quality businesses is a winning strategy.
Portfolio Review
Factoring in size and performance, the portfolio’s largest contributor, and largest detractor, were as follows:
- Palo Alto Networks: 19.32% return, 8.32% average weight
- Salesforce: -14.64% return, 6.91% average weight
Cybersecurity provider Palo Alto Networks had yet another great quarter of stock price gains. This despite suffering a drop in May on slightly weak results: billings grew 3.0% while Wall Street was expecting growth of 3.3% -- hardly the kind of miss that gives us much long-term concern in the business. The company is focusing currently on "platformization" and incentivizing customers to broadly adopt its entire set of security solutions. This is hurting results in the short term as the company offers deals to customers, but we like where the future of the business is headed. Given the performance of shares, we are not alone in that sentiment.
Salesforce saw its stock price decline by nearly 15% this quarter, with most of the decline occurring right after the company's quarterly earnings announcement. The results were good by absolute standards: 11% revenue growth and 44% growth in (non-GAAP) earnings per share. But by Salesforce's standards, this was a disaster. The market was expecting even higher numbers, and this is a company that has a reputation for never failing to meet Wall Street's estimates. In this case expectations were further elevated due to optimism around AI initiatives - even after this quarter's decline, the stock has gained 22% in the past year. Regardless, we see positive signs for the company to continue its place of leadership in the enterprise software game. A quarter - or even multiple quarters - of slightly slower sales growth does not change our long-term investment reasoning that is based on Salesforce's platform being a go-to for business customers to adopt more software services, all while the company continues to improve its profitability.
Portfolio Changes
We added one new company to the portfolio this quarter, investing in medical device company Dexcom. The company is a leading designer and manufacturer of continuous glucose monitors (CGMs), which monitor the blood glucose levels of individuals with diabetes, pre-diabetes, and those with risk factors for moving in that direction. Dexcom introduced its first CGM in 2004 and has more than two million people using its products today.
Unfortunately, there are over 500 million people worldwide with diabetes, a number that is expected to grow by 50% over the next 20 years. Approximately one out of four healthcare dollars in the U.S. is spent on someone with diabetes and this totals ~$20 thousand per year. There is a clear market opportunity for significant expansion of CGM usage and we believe Dexcom is poised to capitalize.
We see the company's technological capabilities in CGM development, investment in manufacturing infrastructure, and its brand reputation with the diabetes community support its efforts to capture its fair share of the CGM opportunity. We expect each generation of CGM will be smaller, have more capabilities, and be cheaper to produce on a per unit basis. This enables a lower per-day cost to the consumer, increased utilization in the population for whom a CGM is "nice to have" but not a "must have," and should result in attractive economics for scaled market leaders like Dexcom.
| QTD | YTD | 1Y | 3Y | 5Y | |
|---|---|---|---|---|---|
| US Large Cap Aggressive Growth | 2.27% | 10.92% | 29.07% | 2.23% | 11.80% |
| Benchmark (S&P 500) | 4.29% | 15.30% | 24.56% | 10.02% | 15.05% |
1. "The Quarter That Split the Market, in Six Charts." Wall Street Journal, 30 June 2024
The above information is intended solely for current clients of Motley Fool Wealth Management (“MFWM”) for the purpose of providing insight into how we manage our strategies and our investment philosophy. This information should not be disclosed to third parties or duplicated or used for any purpose other than the purpose for which it has been provided.
All information presented herein is for informational purposes only and should not be deemed as investment advice or a recommendation to purchase or sell any specific security. This information reflects the opinions, estimates and projections of MFWM as of the date of publication, which are subject to change without notice. We do not represent that any opinion, estimate or projection will be realized. While we believe this information to be reliable, no representation or warranty is made concerning its accuracy.
Performance results are based on a representative account for each strategy, not individual client accounts. Clients can see their actual account performance on the Interactive Brokers’ website at any time. Client account results may not exactly match the performance of the representative accounts. Such variance is due to a number of factors, including differences in trade prices, transaction fees, market activity, any restrictions have you may have imposed on your account(s), and the amount and the timing of deposits or withdrawals.
The performance information presented herein has been generated during a period of extraordinary market volatility. Accordingly, the performance is not necessarily indicative of results that we may achieve in the future, and we do not represent and it cannot be assumed that the performance of our strategies will be subject to the same economic risk factors that contributed to the above returns. Performance results discussed above represent past performance, which does not guarantee future results. The investment return and principal value of an investment will fluctuate so that current performance may be lower or higher than the performance discussed above. The investment strategy and focus of our model portfolio strategies can change over time. Similarly, there is no assurance that the securities purchased will remain in a model portfolio strategy or that securities sold may not be repurchased. The mention of specific holdings does not constitute a recommendation by MFWM or its affiliates.
To the extent we invest more heavily in particular sectors or industries of the economy, the performance of our strategies will be especially sensitive to developments that significantly affect those sectors or industries. While investing in a particular sector is not a principal investment strategy of any model portfolio, client portfolios may be significantly invested in a sector or industry as a result of our portfolio management decisions. Similarly, a model portfolio’s investment may become concentrated in a small number of issuers. To the extent that we take large positions in a small number of investments, account returns may fluctuate as a result of changes in the performance of such investments to a greater extent than that of a more diversified account. Returns realized by a client account may be adversely affected if a small number of these investments perform poorly.
Index performance is discussed for illustrative purposes only as a benchmark for each strategy’s performance, and does not predict or depict performance of that strategy. While index comparisons may be useful to provide a benchmark for a strategy’s performance, it must be noted that investments are not limited to the investments comprising the indices. Each of the strategy benchmark indices are unmanaged and cannot be purchased directly by investors. It is not possible to invest in an index.
This message is provided for informational purposes only, reflects our general views on investing and should not be relied upon as recommendations or financial planning advice. We encourage you to seek personalized advice from qualified professionals, including (without limitation) tax professionals, regarding all personal finance issues. While we can counsel on tax efficiency and general tax considerations, MFWM does not (and is not permitted to) provide tax or legal advice. Clients who need such advice should consult tax and legal professionals. This message may not be relied upon as personalized financial planning or tax advice.
MFWM is an SEC registered investment advisor with a fiduciary duty that requires it to act in the best interests of clients and to place the interests of clients before its own. HOWEVER, REGISTRATION AS AN INVESTMENT ADVISOR DOES NOT IMPLY ANY LEVEL OF SKILL OR TRAINING. Access to MFWM is only available to clients pursuant to an Investment Advisory Agreement and acceptance of our Client Relationship Summary and Brochure (Form ADV, Parts 2A and 2B). You are encouraged to read these documents carefully. All investments involve risk and may lose money. MFWM does not guarantee the results of any of its advice or account management. Clients should be aware that their individual account results may not exactly match the performance of any of our Model Portfolios. Past performance is no guarantee of future results. Each Personal Portfolio is subject to an account minimum, which varies based on the strategies included in the portfolio. MFWM retains the right to revise or modify portfolios and strategies if it believes such modifications would be in the best interests of its clients.
During discussions with our Wealth Advisors, they may provide advice with respect to 401(k) and IRA rollovers into accounts that are managed by MFWM. Such recommendations pose potential conflicts of interest in that rolling retirement savings into a MFWM managed account will generate ongoing asset-based fees for MFWM that it would not otherwise receive.
U.S. Small & Mid-Cap
- The strategy outperformed its benchmark, but was impacted by general weakness across the SMid Cap Landscape
- Significant changes were made to the portfolio in Q2
- Top Q2 performer: Globus Medical (+27.68%)
- Bottom Q2 performer: DoubleVerify: (-44.62%)
- Portfolio Activity: Bought Herc; Sold John Bean Technologies; Added to Goosehead Insurance; Trimmed Watsco and Tractor Supply
Portfolio Managers
Tony Arsta, CFANate Weisshaar, CFA
Small and medium sized stocks continue to struggle. Both the S&P Small Cap 600 Index and the S&P Mid Cap 400 Index declined in value during the second quarter.
Looking at a 30%/70% blend of these indexes reveals broad-based weakness across the SMid Cap landscape. Eight of 11 sectors declined in the quarter and, all in, SMid Caps retreated more than -3.5%. The US Small and Mid Cap SMA strategy bested this performance, but still lost ground. Our real estate holdings continue to suffer as interest rates remain high and the prospect of cuts gets pushed further out. On the bright side, our healthcare investments performed nicely.
While absolute valuation levels appear optically attractive for both Small and Mid Cap stocks, in our view, these broad categories are unlikely to capture investor attention until sales and earnings growth picks up. There is hope for an acceleration in the back half of the year as year-over-year comparisons ease and the domestic economy remains generally healthy.
If that is, in fact, how the world unfolds, we believe the portfolio should do well. If not, we look forward to putting our modest cash balance to work in businesses we believe can grow their value and compound returns for a long time.
Portfolio Review
Factoring in size and performance, the portfolio’s largest contributor, and largest detractor, were as follows:
- Globus Medical: 27.68% return, 4.58% average weight
- DoubleVerify: -44.62% return, 1.13% average weight
Globus Medical's Q1 earnings report in early May drove shares higher. This medical device company focuses on products used in spine surgeries. The integration of its 2023 acquisition of peer NuVasive is proceeding on track with the company taking advantage of cross selling opportunities with the sales teams reorganized into a unified structure. Globus management called out that it is attracting high quality sales reps with extensive experience at other firms. In an industry where sales rep compensation is heavily tied to commissions, that speaks well of Globus' product portfolio and its future prospects.
DoubleVerify has had a challenging year so far, which has weighed on the stock and the overall strategy. The initial concern was that DoubleVerify might engage in a pricing war with one of its main competitors, which would result in lower revenue growth and margin pressure. And despite management's commentary that it wasn't going to engage in a pricing war, that concern remained and its share price was negatively impacted. Fast forward to its most recent earnings report, and that concern was met with a significant downward revision to its Fiscal 2024 revenue guidance. So why the downward revision? Well, it had to do with the spending behavior of some of its larger customers, as well as its business model. Some of its large retail and CPG advertisers have lowered their spending with DoubleVerify, with management calling out that the reduced spend is not DoubleVerify product-related, but rather is tied to company-specific issues with those advertisers. Additionally, DoubleVerify expects more spending being allocated within social and CTV advertising channels from new and existing customers, where lower-priced measurement solutions are currently the main drivers. More volumes flowing towards channels that leverage lower-priced solutions is a one-two punch to its premium solutions. Despite these near-term challenges and signs that consumer spending is slowing down, which would likely result in lower advertising demand, we continue to view DoubleVerify as the superior provider of verification and measurement solutions to digital advertisers as the digital advertising industry continues to evolve and grow.
Portfolio Changes
In April we sold John Bean Technologies. John Bean is merging with Marel, an Iceland-based competitor that would more than double JBT's revenue. This move is transformational and markedly different from the "bolt-on" strategy the company has executed historically. We see considerable execution risk based on size, complexity, and culture, and don't have sufficient evidence from past integrations that management can achieve the benefits it is expecting. This, combined with a lack of clarity on how the combination will widen competitive advantages and allow for greater value capture, prompted us to sell.
In May, we trimmed two strong performers (HVAC distributor Watsco and rural retailer Tractor Supply) and added to Goosehead Insurance, which we believe represented a more compelling opportunity.
Towards the end of the quarter we purchased Herc. Herc is the third largest equipment rental company (think bulldozers, excavators, and aerial lifts) in the US. We have observed the structure of the equipment rental industry improving over the last few years, expect that to continue, and see a few reasons in particular to side with Herc.
Covid exposed the vulnerabilities of supply chains as companies couldn't get key inputs from overseas. Souring US/China trade relations and broadening geopolitical conflict has also threatened key supply lines. Between a trio of massive Federal spending plans (the IIJA, IRA, and CHIPS Act) designed to address key infrastructure and supply chain deficiencies and companies acting themselves to bring manufacturing home there has been and and we expect will be strength in construction end markets. We think Herc, as one of only three scale players in the rental equipment market, will be able to service existing rental demand and benefit from these incremental construction megaprojects.
We normally wouldn't jump at the third place player, but Herc is actually in a sweet spot where it is big enough to benefit from the mega projects cited above but still have them be meaningful in an outsized way. While Herc only has 4% market share of the rental market, we think it could capture 10-15% of the mega project opportunities it might be interested in. We also see it early in its ambitions to add density to its footprint (by opening new locations and buying others) and improving margins through leveraging fixed costs and more efficiently utilizing its rental fleet. This is a playbook we've seen the #1 and #2 players already execute on, and it has contributed to the improving industry structure we noted earlier. In time, Herc should become fully self-funding and drive returns on capital higher.
| QTD | YTD | 1Y | 3Y | 5Y | |
|---|---|---|---|---|---|
| US Small and Mid-Cap | -2.02% | 3.91% | 12.73% | -4.47% | 6.10% |
| Benchmark (S&P Midcap 400) | -3.44% | 6.17% | 13.59% | 4.48% | 10.27% |
The above information is intended solely for current clients of Motley Fool Wealth Management (“MFWM”) for the purpose of providing insight into how we manage our strategies and our investment philosophy. This information should not be disclosed to third parties or duplicated or used for any purpose other than the purpose for which it has been provided.
All information presented herein is for informational purposes only and should not be deemed as investment advice or a recommendation to purchase or sell any specific security. This information reflects the opinions, estimates and projections of MFWM as of the date of publication, which are subject to change without notice. We do not represent that any opinion, estimate or projection will be realized. While we believe this information to be reliable, no representation or warranty is made concerning its accuracy.
Performance results are based on a representative account for each strategy, not individual client accounts. Clients can see their actual account performance on the Interactive Brokers’ website at any time. Client account results may not exactly match the performance of the representative accounts. Such variance is due to a number of factors, including differences in trade prices, transaction fees, market activity, any restrictions have you may have imposed on your account(s), and the amount and the timing of deposits or withdrawals.
The performance information presented herein has been generated during a period of extraordinary market volatility. Accordingly, the performance is not necessarily indicative of results that we may achieve in the future, and we do not represent and it cannot be assumed that the performance of our strategies will be subject to the same economic risk factors that contributed to the above returns. Performance results discussed above represent past performance, which does not guarantee future results. The investment return and principal value of an investment will fluctuate so that current performance may be lower or higher than the performance discussed above. The investment strategy and focus of our model portfolio strategies can change over time. Similarly, there is no assurance that the securities purchased will remain in a model portfolio strategy or that securities sold may not be repurchased. The mention of specific holdings does not constitute a recommendation by MFWM or its affiliates.
To the extent we invest more heavily in particular sectors or industries of the economy, the performance of our strategies will be especially sensitive to developments that significantly affect those sectors or industries. While investing in a particular sector is not a principal investment strategy of any model portfolio, client portfolios may be significantly invested in a sector or industry as a result of our portfolio management decisions. Similarly, a model portfolio’s investment may become concentrated in a small number of issuers. To the extent that we take large positions in a small number of investments, account returns may fluctuate as a result of changes in the performance of such investments to a greater extent than that of a more diversified account. Returns realized by a client account may be adversely affected if a small number of these investments perform poorly.
Index performance is discussed for illustrative purposes only as a benchmark for each strategy’s performance, and does not predict or depict performance of that strategy. While index comparisons may be useful to provide a benchmark for a strategy’s performance, it must be noted that investments are not limited to the investments comprising the indices. Each of the strategy benchmark indices are unmanaged and cannot be purchased directly by investors. It is not possible to invest in an index.
This message is provided for informational purposes only, reflects our general views on investing and should not be relied upon as recommendations or financial planning advice. We encourage you to seek personalized advice from qualified professionals, including (without limitation) tax professionals, regarding all personal finance issues. While we can counsel on tax efficiency and general tax considerations, MFWM does not (and is not permitted to) provide tax or legal advice. Clients who need such advice should consult tax and legal professionals. This message may not be relied upon as personalized financial planning or tax advice.
MFWM is an SEC registered investment advisor with a fiduciary duty that requires it to act in the best interests of clients and to place the interests of clients before its own. HOWEVER, REGISTRATION AS AN INVESTMENT ADVISOR DOES NOT IMPLY ANY LEVEL OF SKILL OR TRAINING. Access to MFWM is only available to clients pursuant to an Investment Advisory Agreement and acceptance of our Client Relationship Summary and Brochure (Form ADV, Parts 2A and 2B). You are encouraged to read these documents carefully. All investments involve risk and may lose money. MFWM does not guarantee the results of any of its advice or account management. Clients should be aware that their individual account results may not exactly match the performance of any of our Model Portfolios. Past performance is no guarantee of future results. Each Personal Portfolio is subject to an account minimum, which varies based on the strategies included in the portfolio. MFWM retains the right to revise or modify portfolios and strategies if it believes such modifications would be in the best interests of its clients.
During discussions with our Wealth Advisors, they may provide advice with respect to 401(k) and IRA rollovers into accounts that are managed by MFWM. Such recommendations pose potential conflicts of interest in that rolling retirement savings into a MFWM managed account will generate ongoing asset-based fees for MFWM that it would not otherwise receive.
Fixed Income
The Fixed Income commentary refers to the following holdings: US Bonds Strategy (Vanguard Total Bond Market ETF; BND), Treasury Inflation-Protected Securities Strategy (Vanguard Short-Term Inflation-Protected Securities ETF; VTIP), and for taxable accounts only, US Muni Bonds Strategy (iShares National Muni Bond ETF; MUB).
Portfolio Review
U.S. Bond markets were modestly positive in the quarter, with core bonds lagging the U.S. Equity market, up roughly 0.2% in Q2. The US Bond Strategy, which holds BND, delivered a gain of 0.12% net of ETF expenses, excluding account level fees and expenses, for the quarter. Continuing last quarter’s trend, long duration underperformed shorter- and intermediate-duration maturities during the quarter. High Yield and TIPS once again outperformed the broader bond market over the period. The US Muni Bond Strategy, which holds MUB, posted a loss just over -0.2% net of ETF expenses and the TIPS strategy, which holds VTIP, posted a gain of 1.4% net of ETF expenses, excluding account level fees and expenses.
US Stock Markets
The US Stock Markets commentary includes the following holdings: US Large Cap Strategy (Vanguard S&P 500 ETF; VOO), US Mid Cap Strategy (Vanguard Mid-Cap ETF; VO), and US Small Cap Strategy (Vanguard Small-Cap ETF; VB).
Portfolio ReviewU.S. Stock Markets were up around 3.5% on average for the quarter, while the US Large Cap Strategy (“Large Cap”), which holds VOO, was up 4.3% net of ETF expenses, excluding account level fees and expenses, during the same period. The US Small-Cap Strategy (“Small Cap”), which holds VBI, continued to underperform the broad market as well as the Large Cap strategy, posting a loss of -4.16% net of ETF expenses, excluding account level fees and expenses, during the quarter. US Mid-Cap Strategy (“Mid Cap”), which holds VO, outpaced Small-Cap, but underperformed the Large Cap strategy, as well as the broad market this quarter, with the Mid-Cap strategy down just under -2.8% net of ETF expenses, excluding account level fees and expenses. In general, Large Cap performance was roughly in line with the broader market, with the Russell 1000 up about 3.6% in Q2. Once again, the technology sector led gains during the quarter, with U.S. stock performance driven by the likes of Nvidia, Apple, and Microsoft driving the Technology and Communications sectors. The Energy, Industrials, and Materials sectors were headwinds for the U.S. market performance. Utilities outperformed the broad market and Consumer Defensives delivered modestly positive gains. Growth indices continued to handily outperform Value indices during the quarter. Higher-dividend yielding stocks continued to underperform the broad market this quarter, broadly flat to down.
International Stock Markets
The International Stock Markets commentary includes the following holdings: International Developed Strategy (Vanguard FTSE Developed Markets ETF; VEA) and International Emerging Strategy (Vanguard Emerging Markets ETF; VWO).
Portfolio Review
The Emerging Markets strategy significantly outperformed compared to the Developed Markets strategy, gaining 5.1% and losing -0.6% net of expenses during Q2, respectively. The Developed Markets strategy faced a significant headwind in weak performances from Toyota and LVMH Moët Hennessy. In Emerging Markets, performance was bolstered by strong gains from Taiwan Semiconductor and Chinese Media platform Tencent.
US Real Estate
The US Real Estate commentary refers to Real Estate Investment Trusts Strategy (Vanguard REIT ETF; VNQ).
Portfolio Review
REITs, which represent most of the Real Estate strategy, had a difficult second quarter. Losses were led by Industrial and Timber REITs Prologis and Weyerhaeuser Company. Strong performances from Residential and Health Care REITs AvalonBay Communities and Ventas, Inc. helped to dampen losses. The Real Estate strategy delivered a loss just shy of -2% net of expenses in Q2.
The above information is intended solely for current clients of Motley Fool Wealth Management ("MFWM") for the purpose of providing insight into how we manage our strategies and our investment philosophy. This information should not be disclosed to third parties or duplicated or used for any purpose other than the purpose for which it has been provided.
PLEASE NOTE that the performance results, presented for the passive strategies/index ETFs, do not represent the performance of MFWM’s discretionary management decisions, nor does it reflect the management fee charged by Fool Wealth to manage client accounts. Third party ETFs in which we invest client assets are subject to fees and expenses (“Underlying Fund Fees”) that are separate from (and in addition to) Fool Wealth’s management fee. These Underlying Fund Fees are passed along to clients. Depending on the strategy, Underlying Fund Fees may be significant. Fool Wealth’s management fees reduce the rate of return on investments. Details of Fool Wealth’s fees for index-based portfolios can be found in Item 5(A) (1)(a) of our Brochure (“Form ADV Part 2A”).
The exchange traded funds (“ETFs”) that Fool Wealth utilizes in our index-based portfolio program are managed by third party fund managers (such as Vanguard and BlackRock) unaffiliated with Fool Wealth, TMF or our affiliates. Third party ETF managers do not pay MFWM or our affiliates any transaction-based compensation (or any other type of fee or payment) in connection with the purchase of their ETFs by Fool Wealth clients. However, clients pay transaction fees (e.g., brokerage commissions) in connection with the purchase and sale of ETFs, and may pay to their custodian account fees and other miscellaneous charges.
The performance and other information included herein were calculated by third parties. While these third parties are reputable and we believe that the information is accurate, we have not independently verified the information.
All information presented herein is for informational purposes only and should not be deemed as investment advice or a recommendation to purchase or sell any specific security. This information reflects the opinions, estimates and projections of MFWM as of the date of publication, which are subject to change without notice. We do not represent that any opinion, estimate or projection will be realized. While we believe this information to be reliable, no representation or warranty is made concerning its accuracy.